
If you’re working off data insights that you manually collect and combine from across all these platforms, you might think you have a solid answer to the question, “Which ad campaigns are working, and which ones are failing.”
After you read this article, you’ll quickly realize what you have is a vaguely accurate answer, but not the right answer. Why? Because depending on individual platforms to give you accurate and honest conversion data that makes sense on an all-grasping ad activity level is like asking the kid who threw the ball that broke the window to tell you who did it (do you really think he’s going to give himself in)?
To get an honest answer, you need an honest source. In performance marketing, you won’t get that from individual platforms. What you will get is just their side of the story. Not the entire scenario.
If you want to learn the best way to find out what’s actually working across your ad campaigns, keep reading. We explain why your ad platforms aren’t the answer, why manual data collation doesn’t work, and tell you what will deliver the unbiased, complete conversion insights you’re after.
Why Ad Platforms Can’t Answer This Question
Ad platforms can’t give you the answer to this all-important question because the data that makes the whole story lives in separate systems that don’t talk to each other.
So let’s take a closer look at the three core reasons why this happens.
Each Platform Only Sees Its Own Data
Meta doesn’t know what Google’s reports are telling you, and vice versa. They just know what they’ve been able to track on their platform (and even that isn’t the whole story).
This is a structural problem. Each platform was built to let you manage ads on its own system, not help you understand your full marketing mix. On top of that, neither platform has a feature that can show you how your organic traffic is performing alongside paid.
What Google Ads & Meta Ads See
- Click and post-click behavior: This includes the click, landing page visits, and any conversion events (purchase and forms) that follow.
- User intent and signals: This includes search terms on Google (real search terms, match types, query-level performance) and behavioral signals Meta (interests, engagement and past activity).
- Ad interaction and visibility: This combines impressions, reach, frequency, auctions and ad engagment (clicks, likes, shares, views), which shows how often your ads are seen and how users interact with them.
- Cost and bidding dynamics: This includes CPC, CPM, CPA, total spend and bid strategy performance, which displays the efficiency of the traffic you’re buying.
- Audience and context signals: This includes device, location, demographics, interesents placements, and time stamps, which tell you who sees your ads and when.
- Relevance and quality signals: This includes Quality Scores (1-10) in Google and relevance rankings in Meta Ads Ads internal rating (1-10) of your ad relevance rankings in Meta Ads, which shows how your ads compare on relevance, engagement and expected performance.
What Google Ads & Meta Ads Can’t See
- How channels work together to drive conversions
- How SEO contributes to conversions and how it links to paid campaigns
- A single, deduplicated consistent version of conversions
- A unified view of cost vs. outcome across channels
- The full customer journey across platforms
- All the ad interactions that can’t be tracked because of various privacy restirctions
Each Platform Uses Its Own Definitions & Metric System
Every platform uses a different metric system to record and provide tracking data, such as views, clicks, and conversions. Google Ads will count a conversion based on a 30-day click window, while Meta might count the same conversion under its 7-day click window.
What happens then is that you get the same conversion, double-counted and reflected in data, which you try to manually compile in your own custom-made spreadsheet.
So, unless you clean the data from every platform and cancel out the duplicates, and adjust the data to make it follow a single attribution model, you’re working with figures that are not directly comparable.
You’ll land a number, but that number won’t be accurate,e and it won’t reflect true performance from each platform.
Each Platform Favors Itself
Lastly, each platform is built in a way that favors its own performance. Everything from attribution windows to conversion definitions and reporting defaults is skewed to maximize credit towards itself.
So if you rely on ad platforms’ native dashboards, you are working with and making decisions based on biased reporting data. This is a data quality issue you can only overcome by using third-party ad tracking tools.
Why Manual Data Collection From Multiple Platforms Won’t Work Either
We’ve already briefly talked about what happens if you try to manually reconcile the data from all your ad channels, but let’s mention a few other problems, which will make you give up on this approach.
- Timing factor – By the time you collate, clean, and align the data so it’s comparable, new data will be in,n and the spreadsheet you’ve created will be redundant. So it’s not an operationally viable process
- Error factor – Working with multiple data sets leaves huge room for human error,r which will have a flow-on negative impact and provide numbers that again, won’t make sense.
- Scale factor – If you’re working with a dozen clients and each one has multiple campaigns across several channels, there’s no way you’ll be able to produce this number of reports in the time you need to optimize ad campaigns.
What Will Work: A Tool That Unifies Data From All Your Channels
Now that we’ve told you all the things that won’t work and explained why, let’s move on to the one tactic and approach that will:
The third-party ad tracking and attribution system that unifies your data and lets you understand and optimize true ad performance in real time.
A Single, Unified Tracking Mechanism (For All Your Channels)
When you switch to a third-party tracking tool like RedTrack, you create a single, independent tracking and reporting layer that sits above and outside all your ad platforms.
It captures every visit and conversion using server-side tracking, so you never miss the touchpoints that ad platrorms can’t collect due to ad blockers and various privacy settings.
RedTrack achieves this by using two components:
- A tracking script which is installed on your site
- URL parameters that are added to you ad links
So when a user clicks on a na ad, the URL parameters spot the source, campaign and ad. Then, when they arrive on your site, the script fires, recording the visit using that same information. And finally, when a conversion takes place, it gets captured and matched right back to the original click.
Now this process is the same no matter which ad channels your customer interacted with. Whether the click came from Google Ads, Meta Ads or an organic source, RedTrack collects and traces all interactions using this one consistent method and logic.
Consistent Conversion Definitions (Applied Across All Platforms)
When you have a complete and accurate set of conversion data sitting within RedTrack’s centralized system, you have everything you need to start slicing and dicing that data in multiple different ways to better understand your marketing campaigns’ performance.
RedTrack lets you apply the conversion definitions and attribution models you like to your data set from across multiple channels.
Also, you’re not limited to sticking with one. You can alterate between attribution models for the same campaign to see and compare results in more detail and to understand gaps and find out different insights.
For example, you can use the Attribution Modelling feature to compare:
- First-Touch vs. Last-Touch – To find out which channel introduces the user, and which one closes the deal.
- First-Touch vs. Linear – To spot the channels that play a major role in assisting conversions.
- Last-Touch vs. Time-Decay – To discover which channels influence decisions close to conversion.
The Ability To Dive Deep Into Your Data (From Channel-Level, to Individual Ads)
You might start with a top-level summary showing how Google Ads campaigns compare to Meta Ads campaigns, but if you’re a serious media buyer or performance marketer, you’ll want to dive deeper.
Having a unified view of your major traffic channels conversion data side by side is great at channel-level but what makes RedTrack super helpful is that you cna actually drill down for each channel to multiple levels including:
- Campaign
- Ad Group
- Individual ad
While overall summary tells you which channels to focus on, drilling down to the lower layers will guide you on what you need to do with them.
The Price Your Pay if You Don’t Use a Unified Tool
The price you end up paying if you don’t have a unified set of accurate data will ultimately cost you in bad optimization decisions that compound in the long term to deliver unimpressive ad campaign performance results.
Here are just a few possible scenarios and their impact.
You Optimize Each Channel in Isolation, Instead of Across the Journey
When you use platform-provided data to optimize campaigns across Google and Meta, you might end up scaling campaigns that look effective in one, but which don’t deliver as a whole (they might not be converting in the real world).
Because you have no way of knowing how all your channels work together, you operate and optimize at separate platform levels when the journey is actually one. That’s why the data needs to be one, also.
Slow-Moving Channels Look Like They Aren’t Working, So You Drop Them
This is one of the biggest destroyers of blog content, which rarely gets seen or recognized as an assisting factor in conversions. Blog content contributes to conversions over extended timeframes. So, a post that generates awareness might not appear in a 7-day attribution window, even though it was a driver of that week’s sales, even if it was part of a user’s customer journey that eventually resulted in a conversion.
So if you don’t have a way to view organic activities alongside paid, there is no way you can identify the value and contribution of SEO activities like blog content. This dynamic is what causes SEO to suffer more than any other channel and to be systematically overlooked in budget allocation conversions.
You Spend More Time Building the Picture, The Acting On It
If you’re spending hours or days on ad performance reporting, that’s the time you could be spending optimizing all your campaigns (that is, if you had the right tools doing the number crunching and sorting for you).
The more channels you operate on, the harder and more time-consuming reporting becomes. And no matter how much of a data buff you are, there’s no chance you can be as accurate as a tool that automatically collects, cleans, and applies a unified metric system to the entire lot of data.
How RedTrack Gives You the Answers You Need
RedTrack gives you three ways to use its system so you can finally answer the question, “How do I actually know what’s working across Google Ads, Meta Ads, and SE??O”
1. Reports: All Your Channels in One Dashboard
If you want to see performance across all your ad channels, you need to go to Reports.
Here, you’ll see all the traffic sources you’ve added in a single view, and it will show you the numbers for the same set of metrics for each. If you want to see which channel gets credited for a conversion, this is where you’ll go.
It includes everything from clicks, conversions, cost, revenue, CPA, and ROAS.
Top tip: Every row is expandable. You can open a traffic channel and break it down into campaigns, or select a campaign and break it down into an ad group.
Setting up the Reports cross-channel view
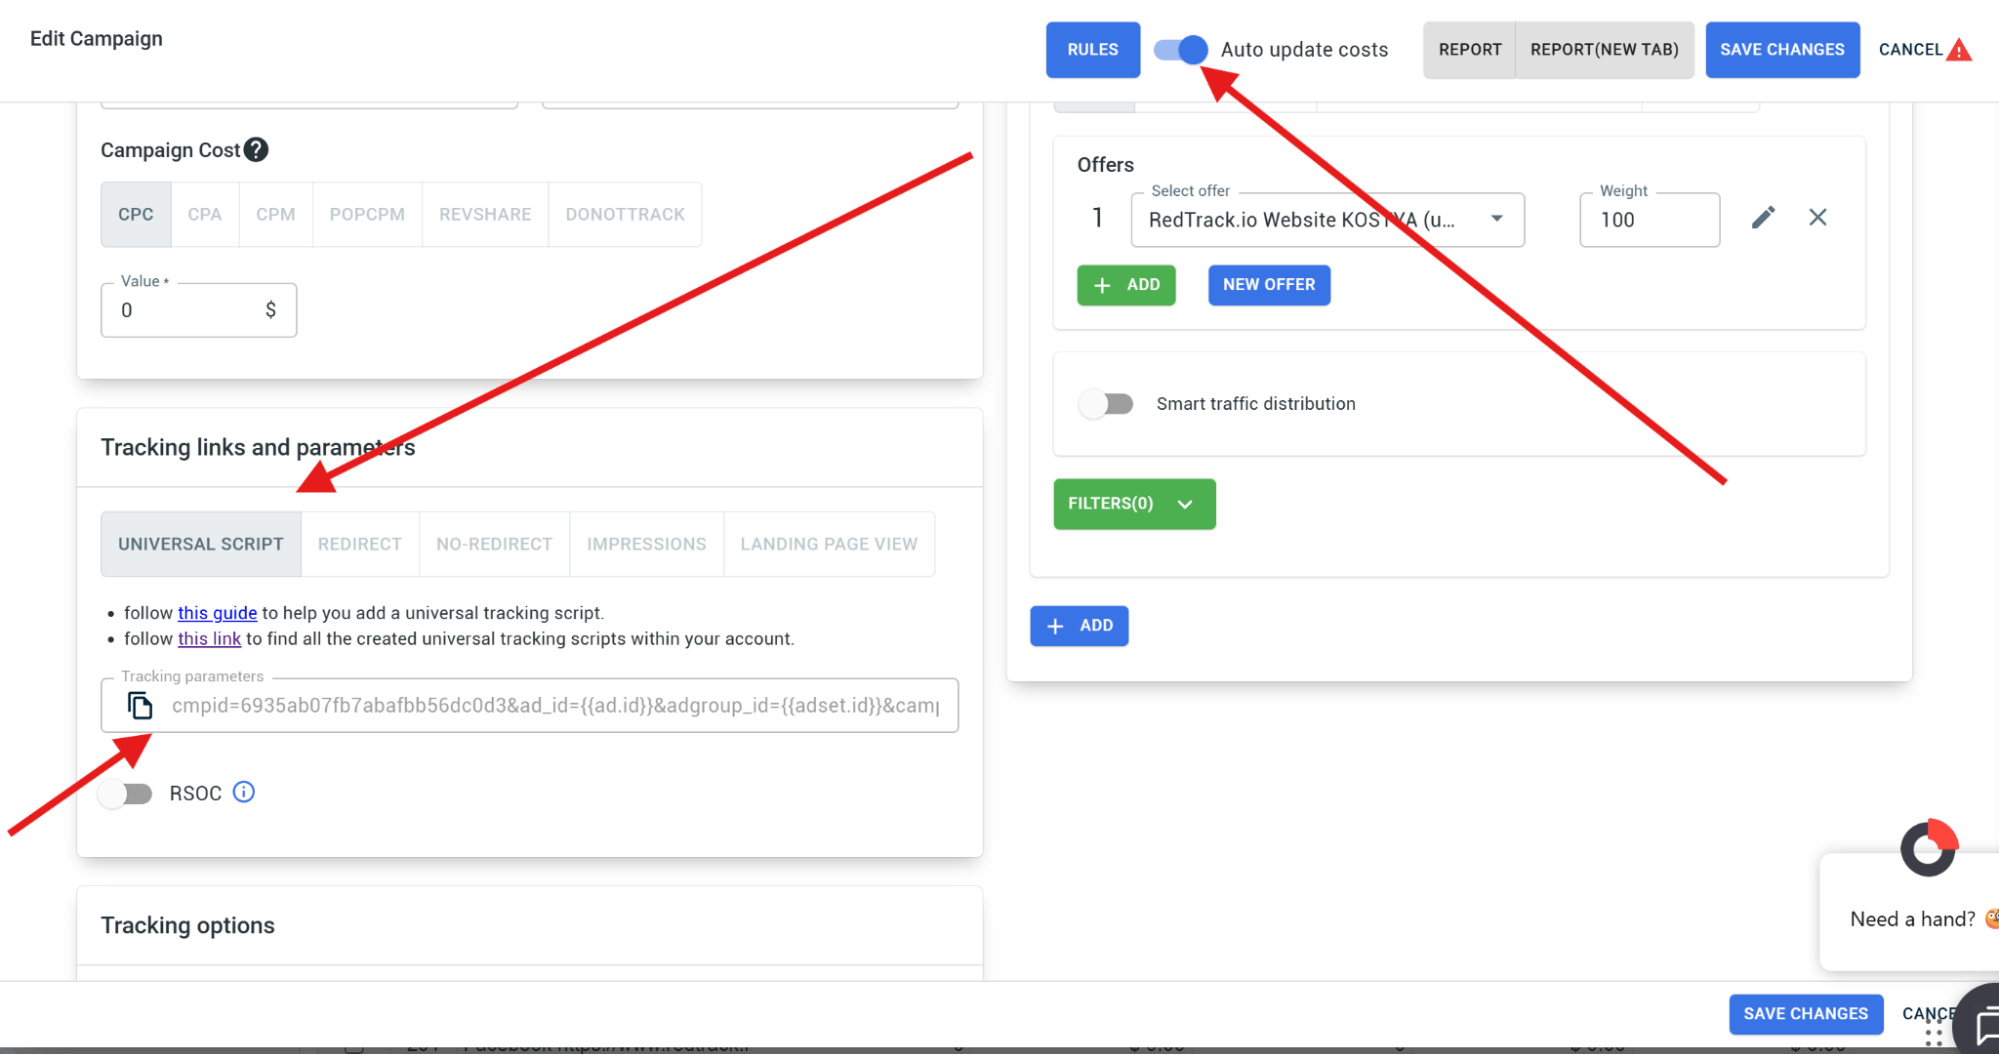
First, install the RedTrack tracking script on your website as the script is what captures click and conversion events independently.
After that, tag your ad URLs with RedTrack’s tracking parameters. Each traffic source, campaign and ad gets its own parameter set which is what tells RedTrack which channel and campaign sent each click. RedTrack generates these parameter slugs for you.
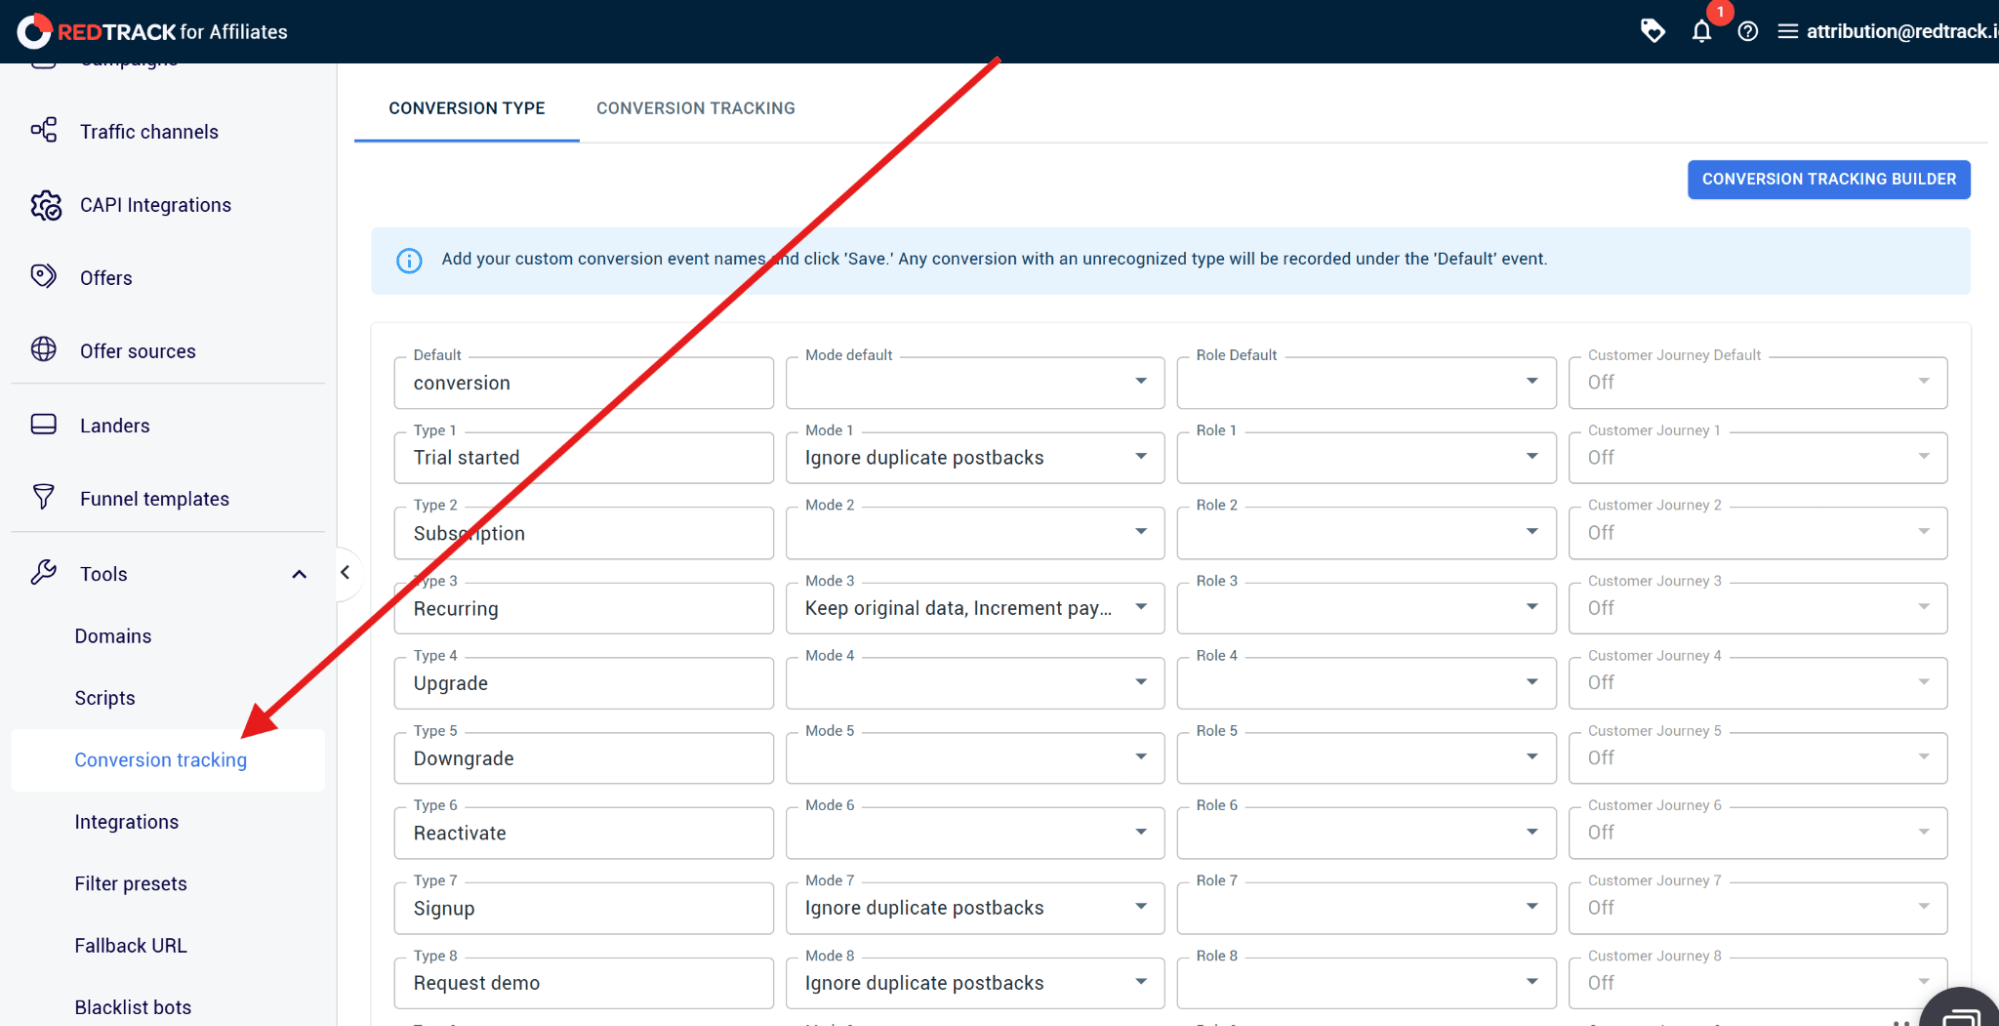
Third, define your conversion events in RedTrack. It can be a purchase confirmation page load or a server-side postback from your backend. These events are what get attributed back to the originating click.
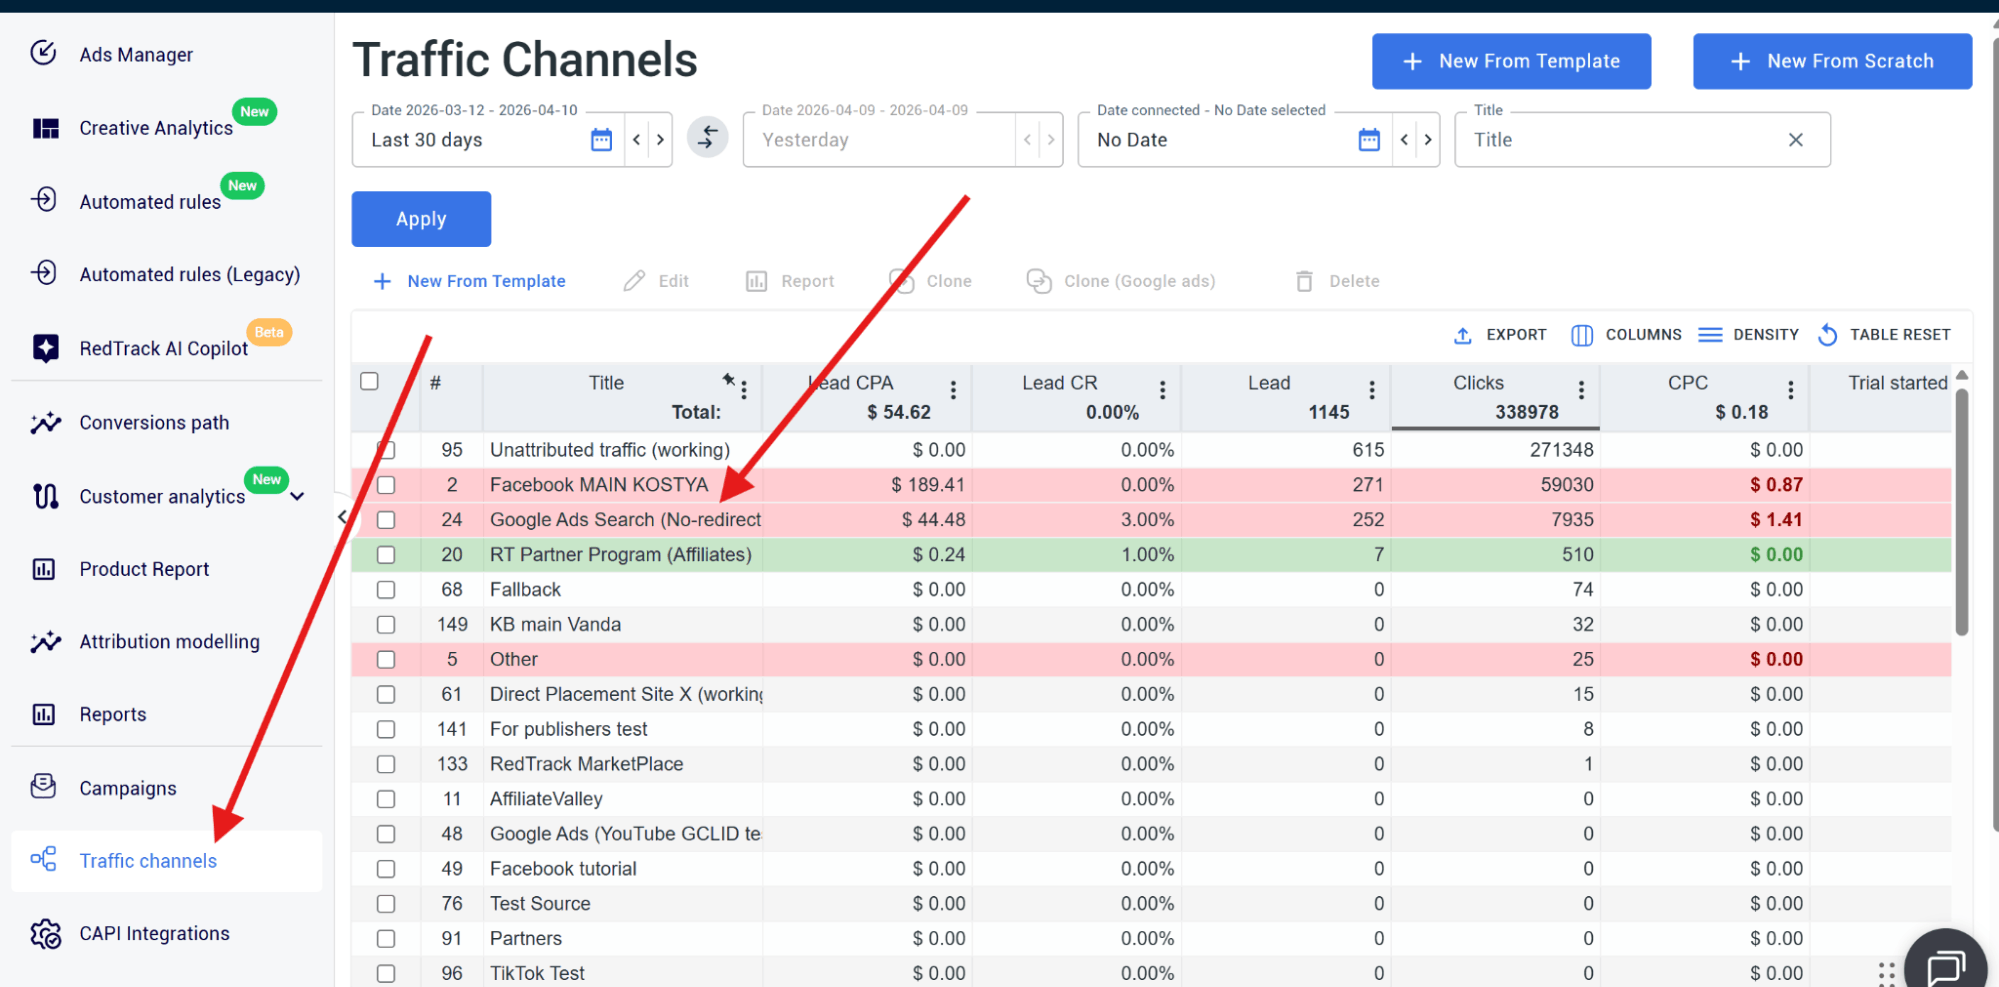
After that, connect your ad platforms for cost sync. It has nothing to do with tracking, but pulling spend data from ad platforms so RedTrack can calculate ROAS and CPA per channel. Cost sync runs automatically every 5-30 minutes once connected.
With that out of the way, open Reports and set the date range, and set the top-level grouping to traffic channel to see the channel-by-channel comparison.
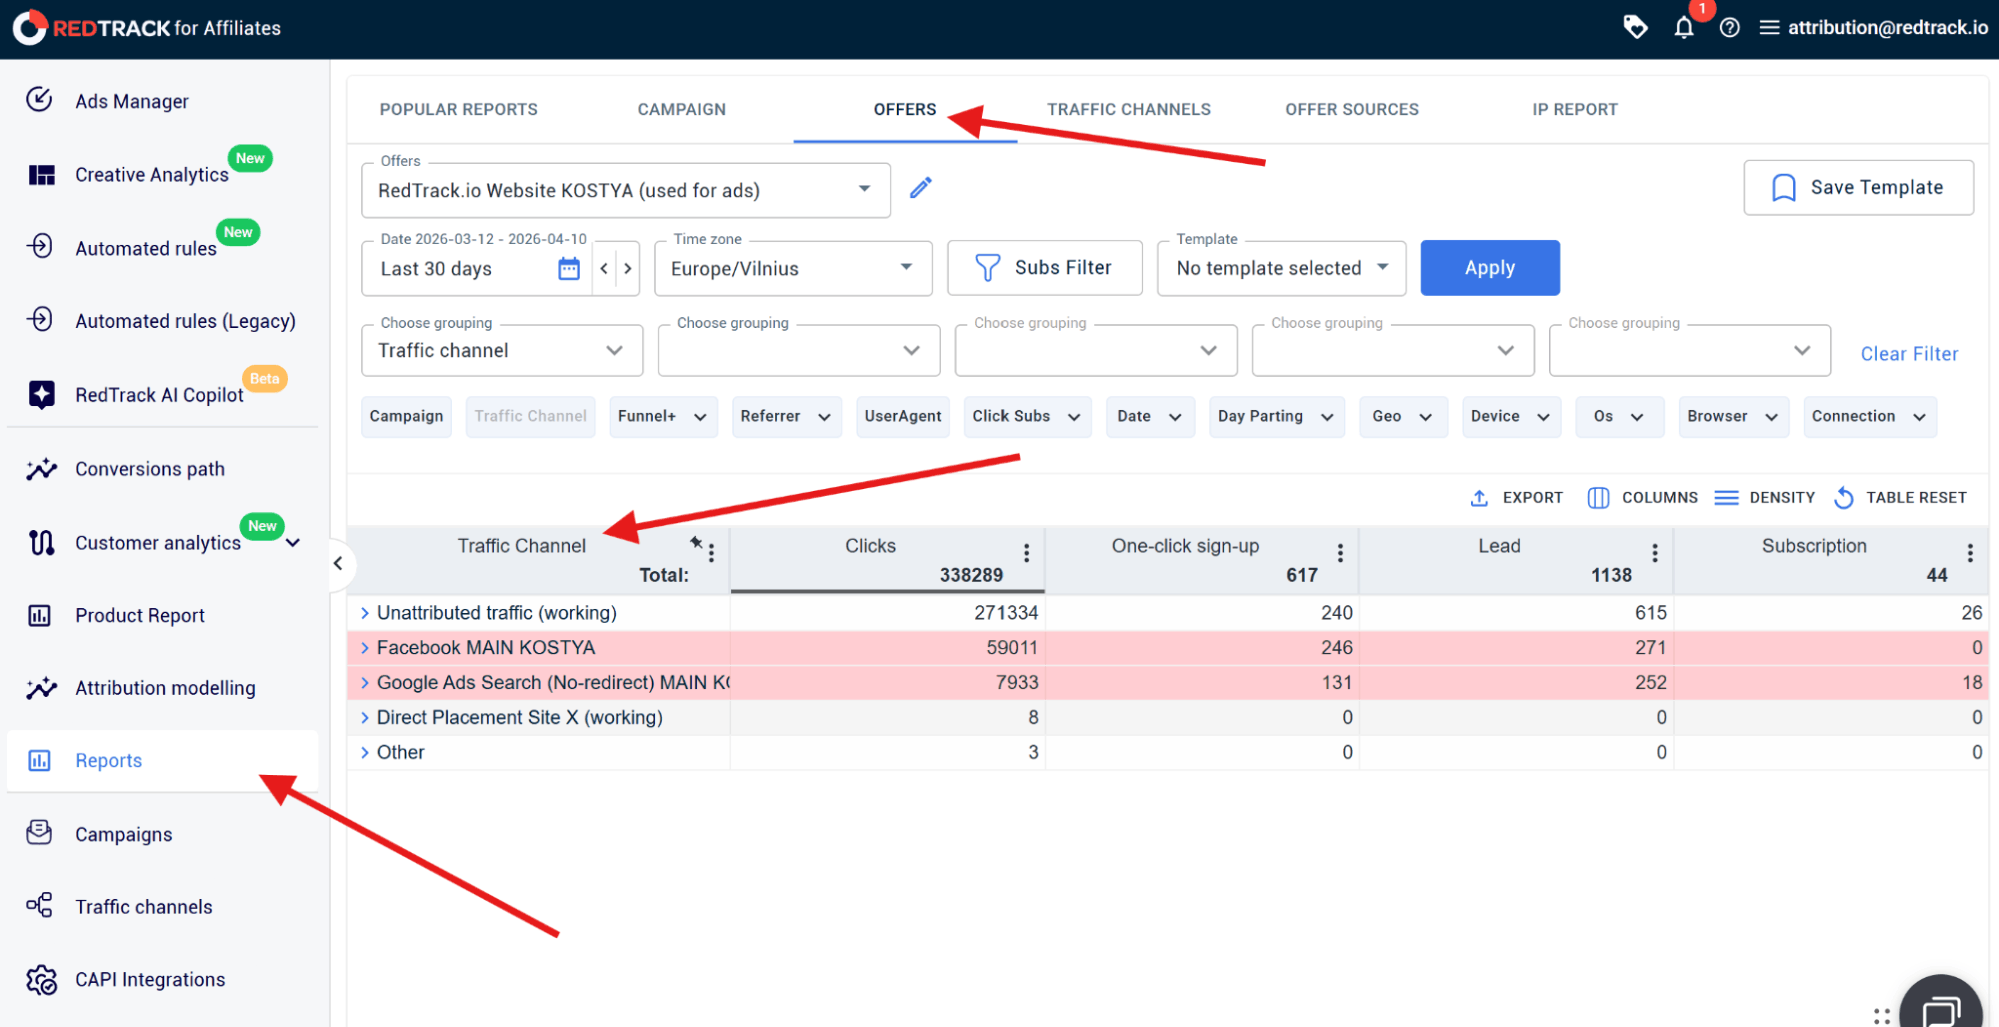
You can add the columns you want to compare and save the configuration as a template so you don’t need to rebuild it each session.
To drill down even further, click any channel row to expand it to campaign level. Click again to reach ad group and then individual ad level.
2. Conversion Path: See the Full Customer Journey Behind Every Conversion
But if you want to see the sequence of interactions that took place before each conversion, you’ll go to Conversion Path.
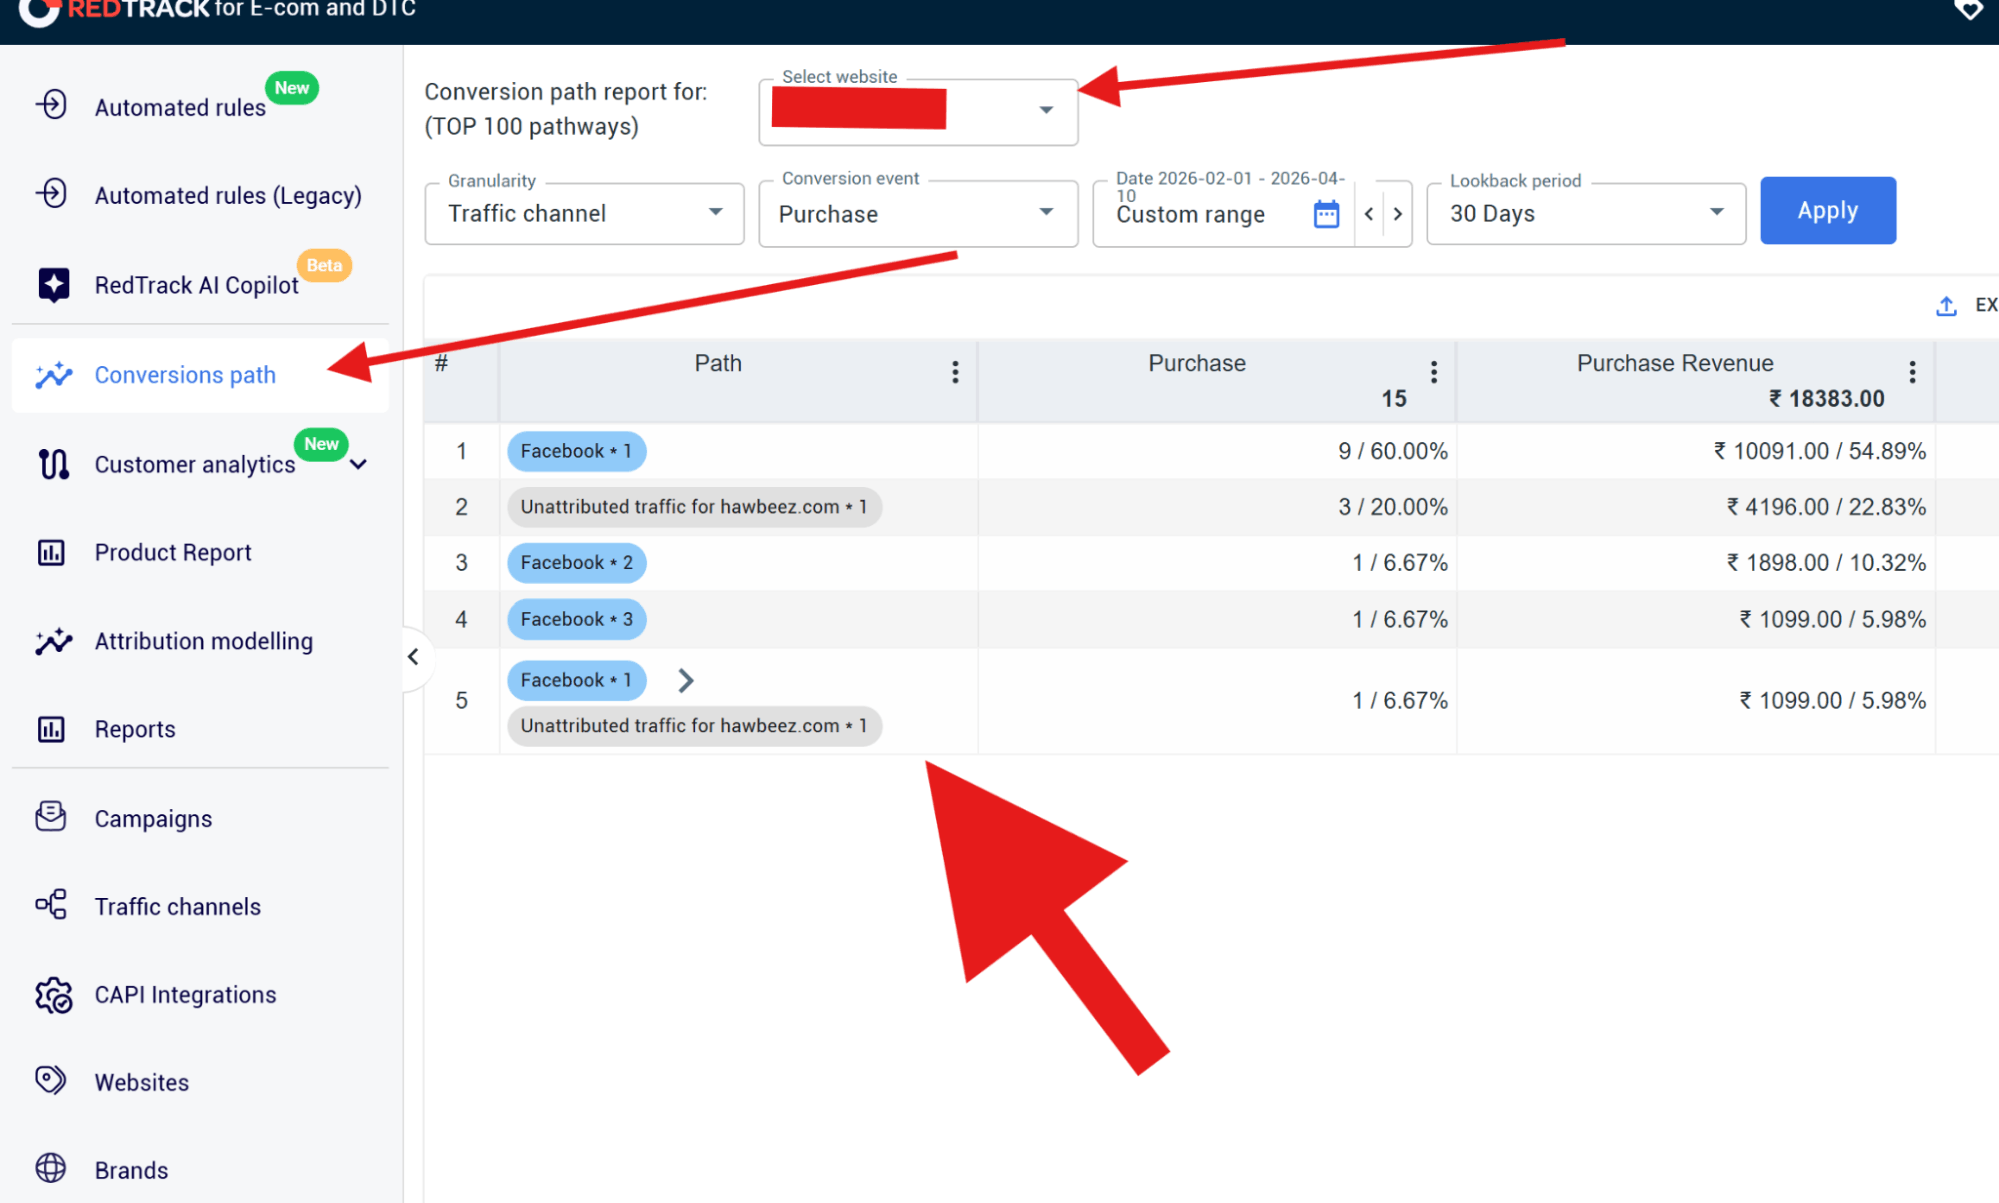
This section goes deeper than Reports, and it can answer more complex questions like, “Are Google clicks appearing at the start of the journey, but are they later converting through Meta”?
Top tip: For a media buyer who’s doing initial prospecting on Google and then following with a round of Meta retargeting campaigns, the Conversion Path section can provide valuable insights into how dependent the two channels are on one another.
3. Attribution Modeling: Analyse Credit Distribution Alternatives
Finally, if you want to work out which channels deserve credit for your conversions, you need to play around in the Attribution Modelling section.
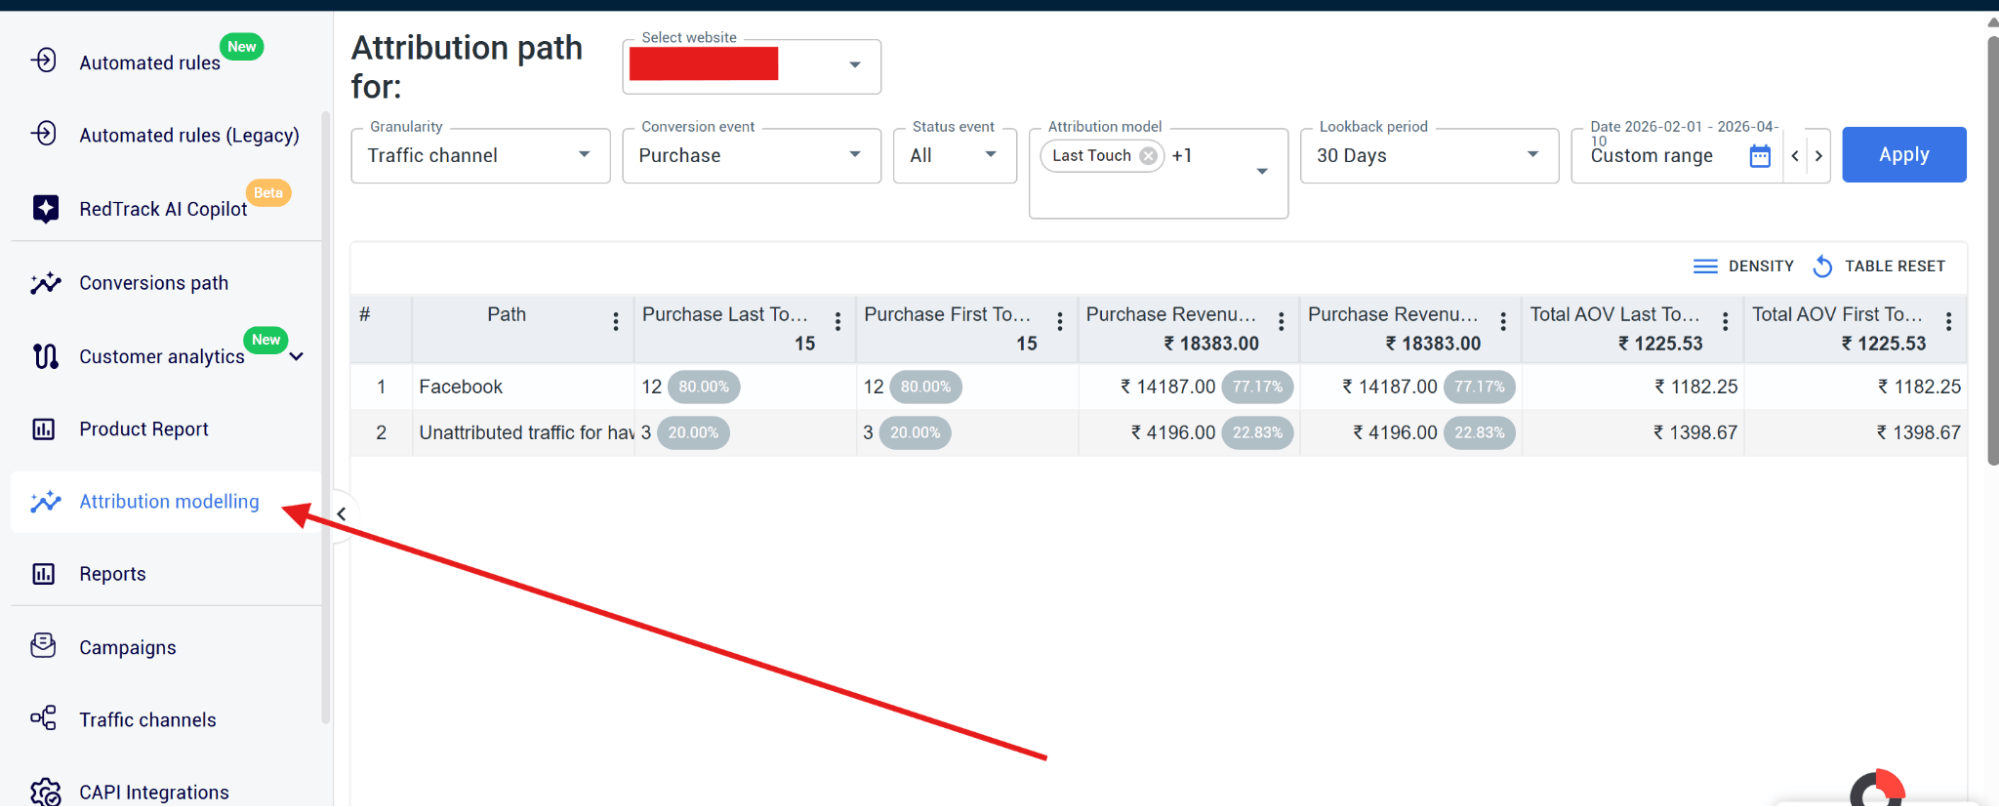
The reason we say play-around is that this is where you can apply different attribution models (last-click, first-click, linear, and more) to one set of data to see how each one favors different channels.
This can be an eye-opener for many ad campaign managers, and it can completely change the way you choose to allocate budgets in the future.
Top tip: Use it alongside Reports to work out if a channel is over-claiming credit that really belongs elsewhere.
RedTrack: One Tool to Make Sense of All Your Ad Platforms
Different ad platforms will give you their own data and insights, but neither will help you quantify the value of SEO activities such as blog posts. If you want ad tracking and attribution data, you can count on that also takes into account your SEO content, you need something more advanced. You need an independent, third-party tracking platform like RedTrack.
RedTrack brings everything into one centralized system and tool where you can compare and play with accurate data to better understand the impact of your performance and marketing activities. Instead of jumping back and forth between platforms and trying to align all the numbers to one measurement system, you get a single platform that sits above everything.
You identify the entire customer journey that sits across multiple ad platforms and finally get to see how they work together to deliver you conversions. And when you have that, you can stop making optimization decisions on isolated data sets that don’t match, and start making a strategically viable framework that drives profits into the future.
With RedTrack, you get every click and view tracked because it operates on a server-side tracking model. No ad blockers or browser and device privacy settings breaking the path. You see which channels introduce users, which ones nurture them, and which ones close the loop.
This is a tool every performance marketer and media buyerneeds. If you want to find out more, book a demo call with one of our people, today. And if you’re ready to give it a go, sign up for our 14-day free trial.


