It’s Monday morning and you just checked in.
You opened the dashboard and you see conversions are down 40% from last week, spend is roughly the same, revenue has dropped and ROAS is in red.
First off: good morning!
Second, you have no idea what happened.
Was it the pixel? Did your postback stop firing? Did the creative fatigue? Is the market off this week? Was your ICP hit by asteroid?
Each is a different fix (except from the last one, there’s no recovering from that), and each takes hours to diagnose (again, except from the last one, that one would make the news).
There’s no way for you to know exactly what is it, so you do what every media buyer does in this moment: you open four tabs, ping the network, stare at Events Manager, and guess.
The challenge: Your performance monitoring dashboard can’t tell you what’s actually wrong
All your dashboard does, it shows you that conversions dropped.
Details are kept in deeper investigation, usually the one that follows after such event, because a single dashboard can’t tell whether the conversions actually stopped happening, or whether they stopped being recorded.
There are multiple problems with this challenge.
1. Dashboards report outcomes, not diagnoses
Every reporting tool you use including Meta Ads Manager, Google Ads, Google Analytics 4, your store backend, your affiliate network, you name it, shows you the conversion count for a period, and when the count drops you see a smaller number than last week. That right there is outcome.
They don’t show the reason for outcome. Just that it happened.
2. Tracking failures happen silently
There’s no announcement to broken tracking component. There’s no console error warning for the broken pixel. There’s no returned 404 for the postback URL that you’ll notice. Conversion PAI keeps connecting, but it’s just sending events with degraded match quality that Meta quietly fails to attribute.
The result happens silently because there’s nothing to trigger an alarm, as every system is still working:
- Revenue arrives a bit smaller
- Match rate slides from 85% to 30% over a few weeks
- Unattributed share goes from 8% to 25% over time
All. Happens. In the background. And over time.
3. Manual diagnostics
So when you catch it – you gotta troubleshoot it by yourself.
Check the pixel in Events Manager.
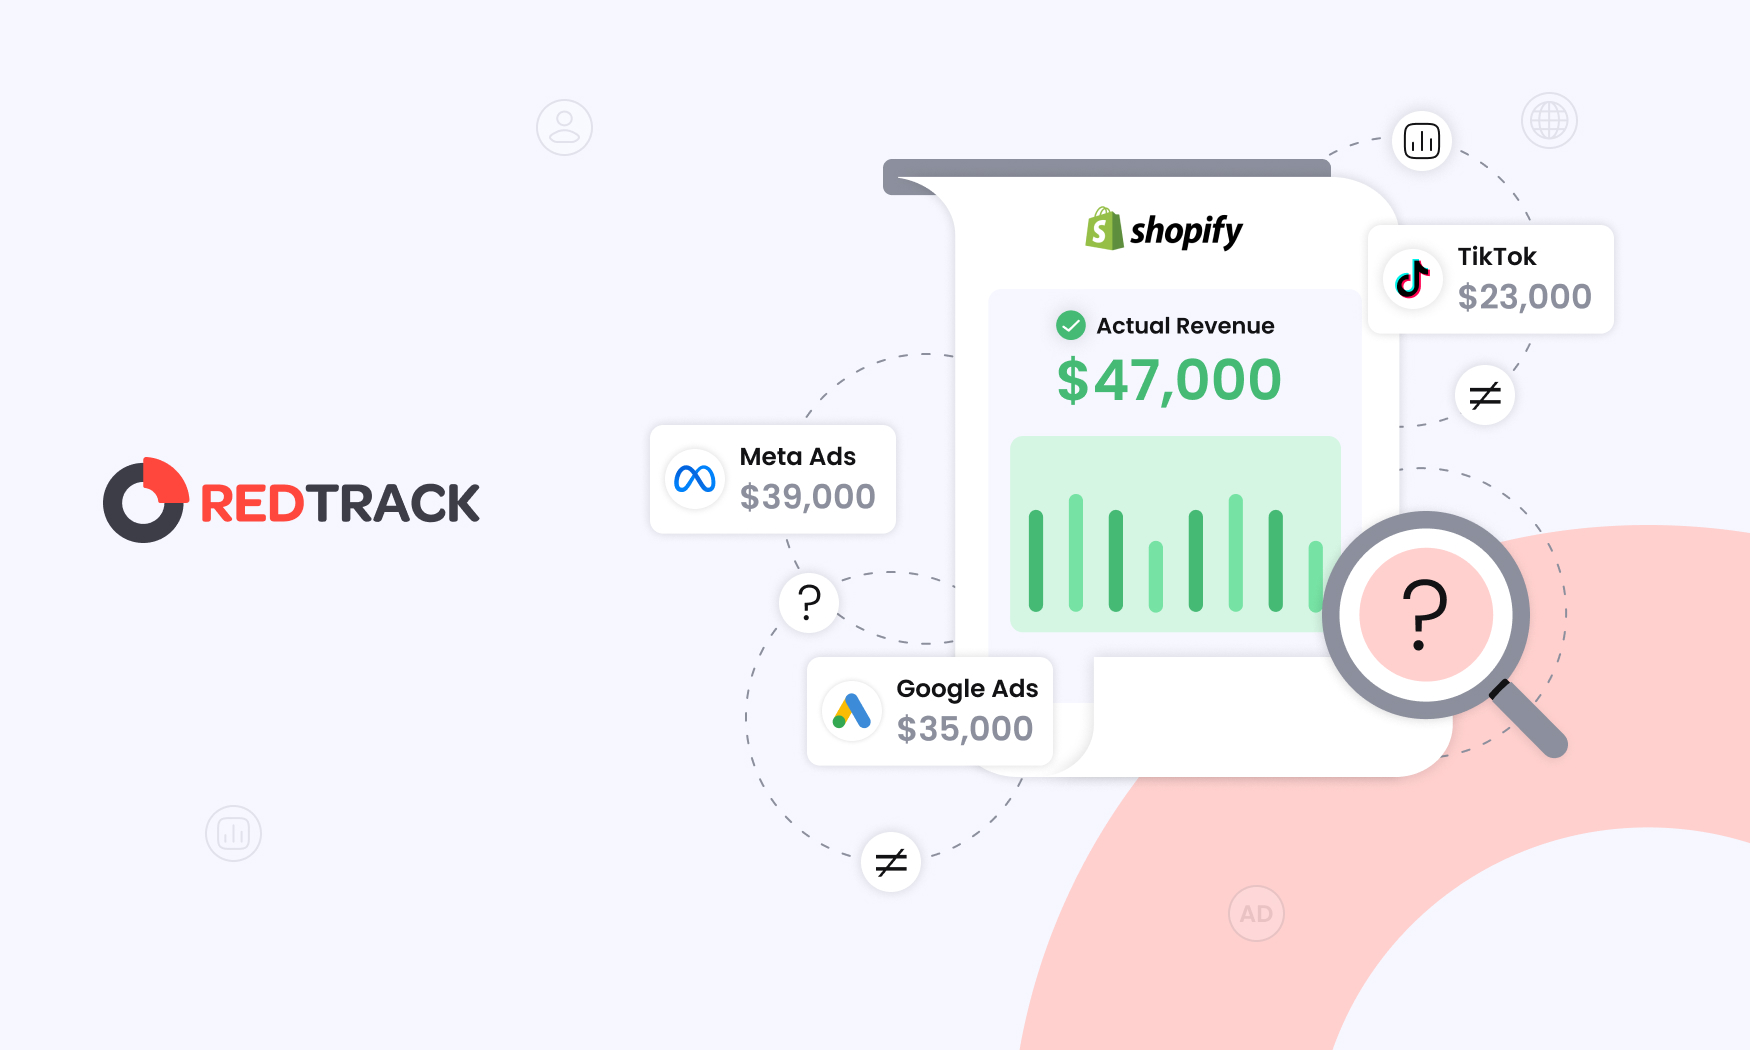
Compare numbers between Meta and Shopify.
Open the offer page.
Pint the network and ask if the postback fired.
Re-run the test conversion.
Export a CSV and compare.
Several hours of work to answer one binary question: is the problem tracking or campaign.
4. You’re paying for the guesswork
Every hour you can’t answer the tracking-vs-campaign question immediately costs money, and you make a wrong decision, and those decisions compound.
The most common wrong decision is you pause the campaign to stop the bleeding, and it’s justified – conversions dropped, and you don’t know why. Seems logical to pause the campaign.
But the campaign was fine. Your Conversion API was sending events without fbp or fbc parameters for three days, so Meta couldn’t match them to users. Conversions were happening, you just couldn’t see them. You paused a profitable campaign for nothing and lost a week of compounding ad delivery training.
On the opposite side, the mistake is just as costly – your Conversion API match rate drops to 30% silently. Meta’s algorithm loses signal and starts delivering ads to an audience that’s far from perfect fit.
Campaign still looks fine on Monday because your dashboard averages tracked conversion across the comparison window.
You scale a campaign that has effectively gone blind, and the audience degradation accelerates.
Another problem on top of these two: burned hours on something that should have been automated.
If you run paid media for a living, you already know how many hours per week go to troubleshooting broken stuff.
If you don’t, we’ll tell you:
On average, in normal week, 3 hours go to troubleshooting problems that occur in active campaigns, while a bad week can take up to 12 hours of troubleshooting.
Cost of those hours from just one occurrence is a price of the solution to take care of that problem.
Speaking of solution…
Solution: RedTrack Pulse as a diagnostic tool for answering “Is it campaign or tracking” problem
If you could have a solution that knows how to troubleshoot manually you would never spend all those hours trying to understand where and why the problem occurred…
Let’s break it down how the solution to this “Is it campaign or tracking” problem actually looks like:
There should be a conditional check: did spend stay stable while output dropped?
If yes, it’s a tracking problem.
If both dropped proportionally, it’s the campaign or the market.
There should a system that performs this check automatically, 24/7, without you asking.
And we’ve built it.
It’s the system that watches the upstream health signals so you catch problems before they compound into a quarter of lost optimisation.
It’s also important to mention that what counts as normal for your account is not what counts as normal for someone else’s – if you’re an affiliate running native traffic, you might have 25% unattributed conversions as a healthy baseline, but if you’re an eCommerce brand running Meta, you might have 5%. A drop from baseline only matters if the baseline is calibrated to your own history, not to absolute thresholds someone else chose.
So what is the system we’ve built?
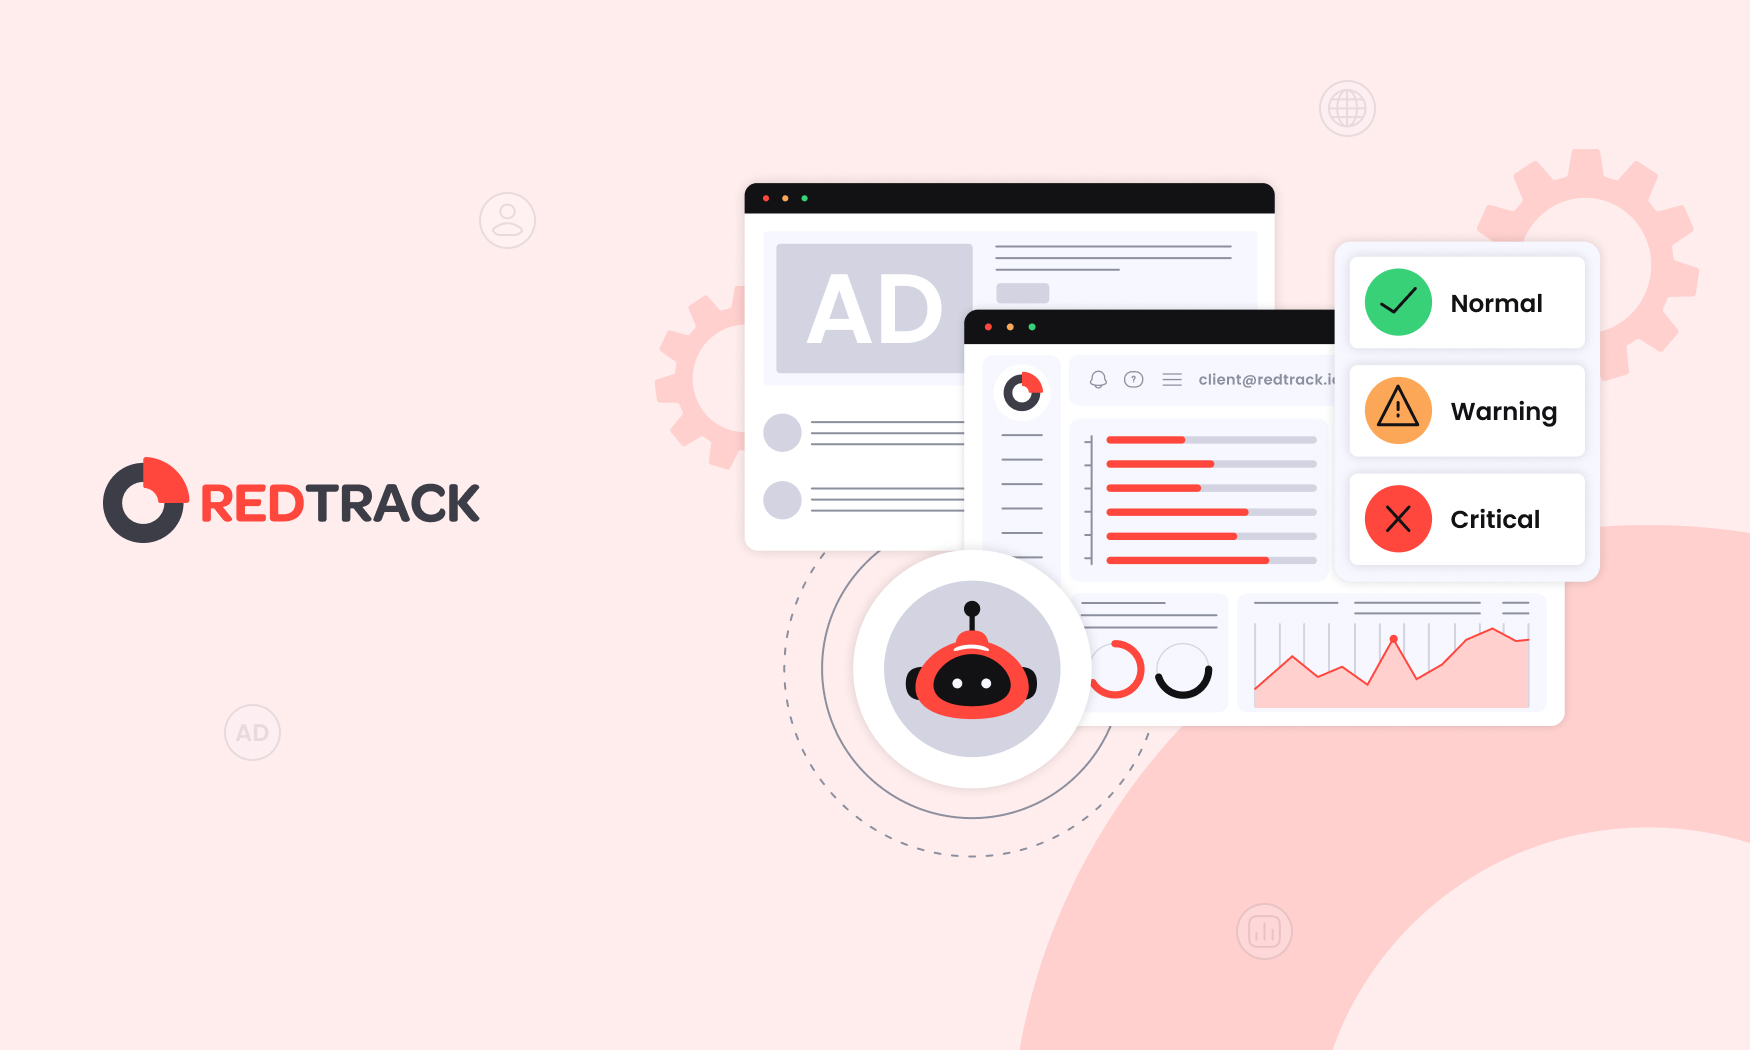
RedTrack Pulse is an automated tracking health monitor inside your RedTrack account with one sole mission – to answer the question can you trust your data right now, and if not, where is it broken?
It’s part of ad tracking software, and here’s how it looks like in real life appliance.
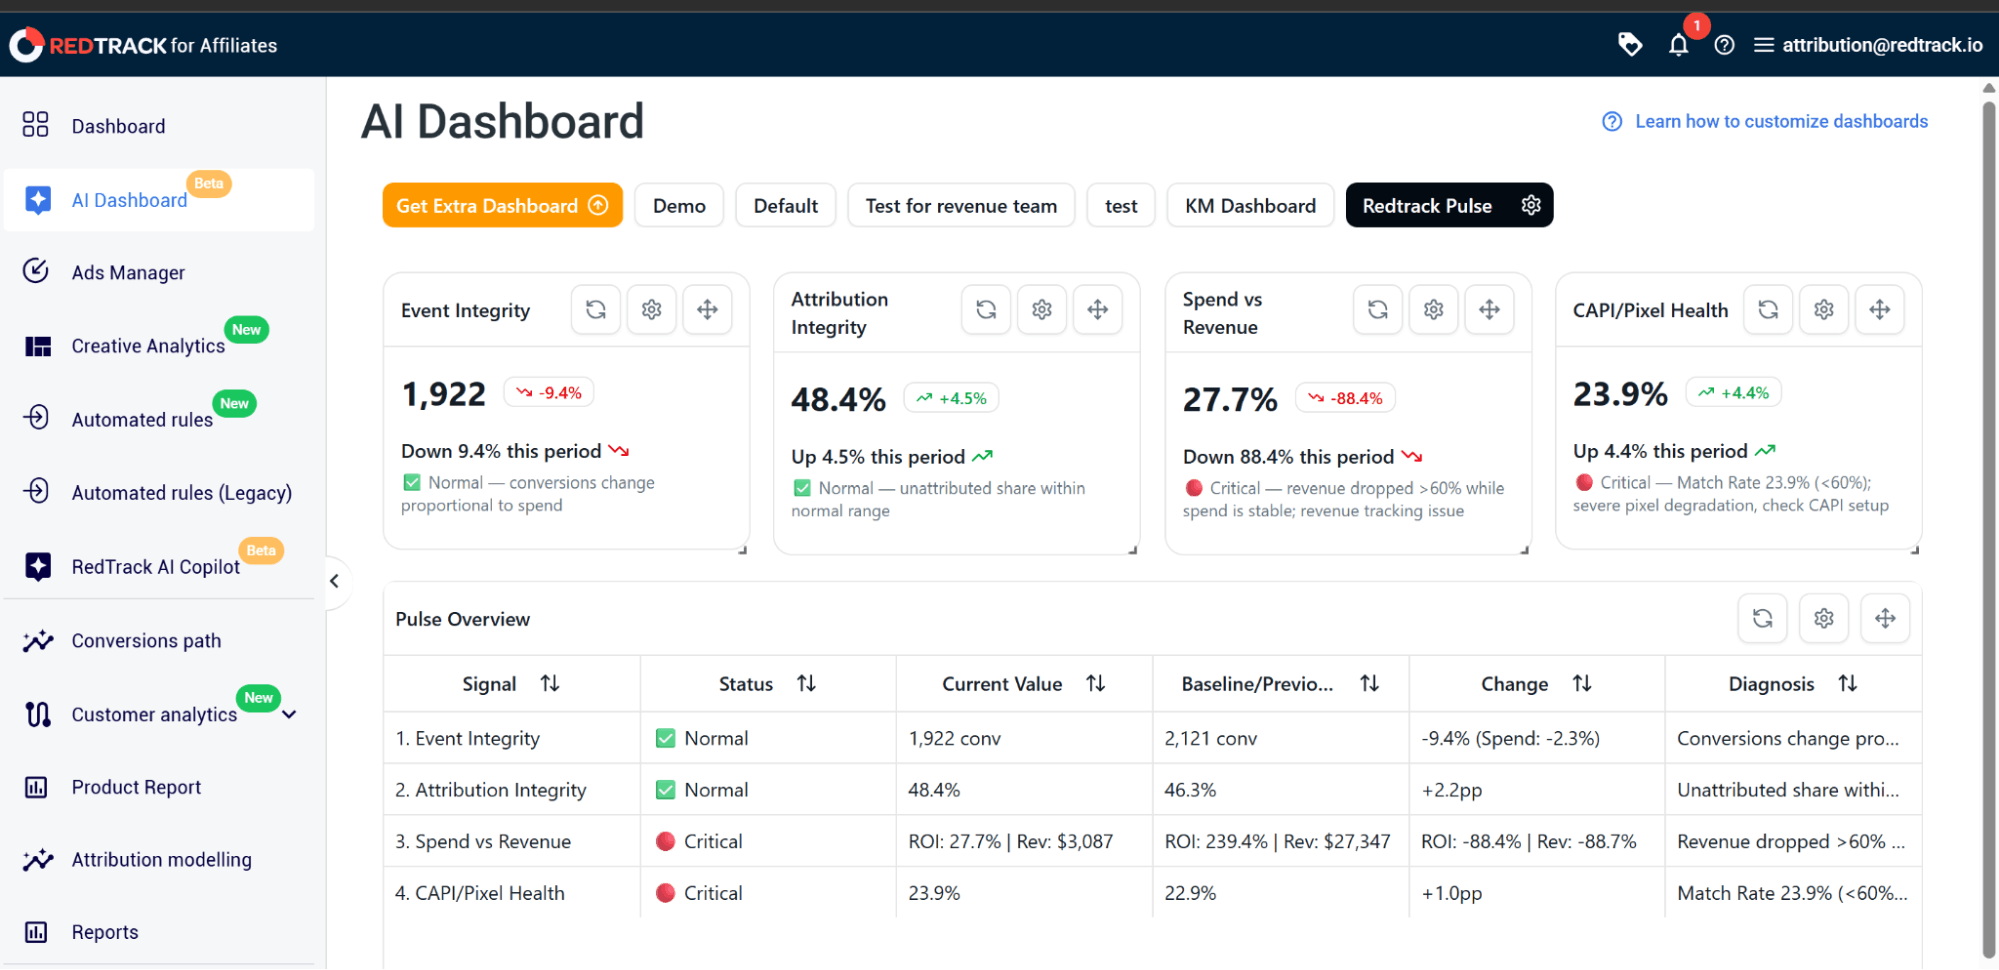
It compares the current 7 days against the previous 7 days across four signals, performs the spend-stability conditional check on each and labels every signal (Normal, Warning, Critical, or N/A with simple explanation).
Event Integrity and Spend vs Revenue signals
Event Integrity and Spend vs Revenue signals from the RedTrack Pulse do the conditional check you would do manually.
Event Integrity watches for conversions dropping more than 50% week-over-week while spend stays within a 15% corridor (the classic broken pixel, postback or Conversion API fingerprint).
Spend vs Revenue catches the related pattern – money flowing out and revenue not coming back, or revenue down more than 60% with spend table (usually a postback not transmitting the revenue parameter, a missing payout or an affiliate network model change). If any of them go Critical, the issue is on the data side. If they both stay Normal, the drop is real performance.
Attribution Integrity and Conversion API/Pixel Health signals
On the other spectrum, RedTrack Pulse’s Attribution Integrity and CAPI/Pixel Health signals exist for failures with delayed effect.
Attribution Integrity tracks the share of unattributed conversions against your account’s own 7-day rolling baseline, and flags when it jumps more than 10% (Warning) or 20% (Critical). The cause of these might lay in the fingerprint of broken UTM tags, a misconfigured attribution window, or a new traffic source running without proper tagging.
CAPI/Pixel Health watches Meta’s Event Match Quality score or to be more precise how well Meta can match your CAPI events to real users. Below 75% is a Warning; below 60%, or a week-over-week drop of more than 25 points, is Critical.
This is extremely useful because match quality degrades silently, meaning, conversions still arrive in RedTrack, revenue looks fine, but Meta’s algorithm is increasingly delivering ads to the wrong audience. That’s exactly where Pulse catches the degradation upstream, before two weeks of optimisation are lost.
Pulse activates the moment your RedTrack account is collecting data. What that means is that every baseline is calculated from your account’s own 7-day rolling history.
That also means, no configuration, no threshold tuning, no rules to write.
How to access and read RedTrack Pulse
In order to access and read RedTrack pulse, follow these steps:
- In your RedTrack account, open AI Dashboards in the left navigation.
- Select Redtrack Pulse
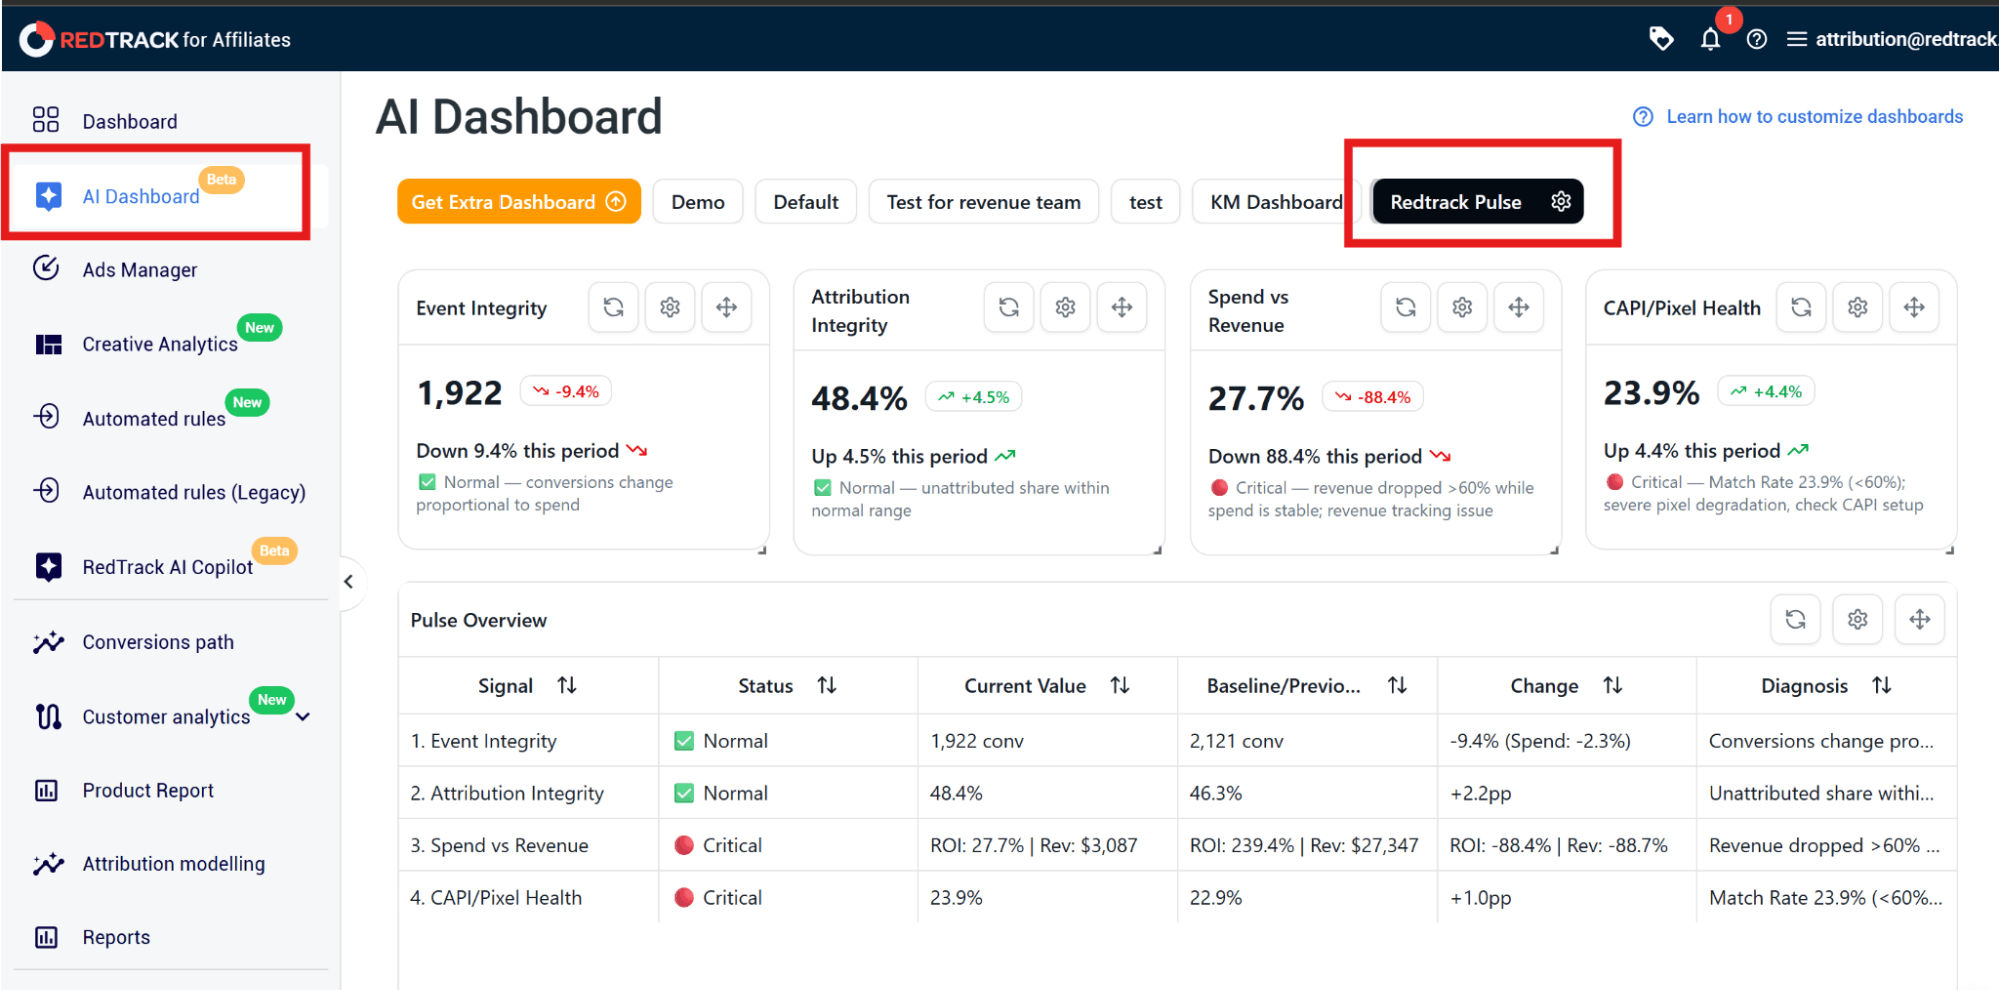
- Review the four signal tiles – each shows the current Normal, Warning, Critical, or N/A status with the week-over-week change.
- Click any Warning or Critical to see the underlying numbers and the threshold crossed.
- Use the plain-language cause list under each Critical signal as your diagnostic starting point.
Scenarios and how to act on each Pulse Status
RedTrack Pulse gives you a diagnosis, and even though diagnosis tells you exactly where to look first, acting on that diagnosis is still your decision.
My Event Integrity or Spend vs Revenue went status Critical
If your Event Integrity or Spend vs Revenue went Critical, that means you need to fix the data pipe first.
Status Critical on Event Integrity means conversions are not flowing into RedTrack the way they were last week, so before changing anything in your campaigns, check the conversion pipe.
For ecommerce: confirm your store-side script and webhook are still firing and Conversion API events are arriving with quality parameters.
For affiliate: ping the network and verify postbacks are being sent with the click ID and revenue parameter intact.
DO NOT pause your campaign if your Event Integrity or Spend vs Revenue is critical, as that is the most expensive mistake you can make!
My Conversion API or Pixel Health went status Critical
If your Conversion API or Pixel Health went Critical, that means Meta is increasingly unable to match your Conversion APi events to real users, even though events are arriving so you should audit your event quality before scaling anything.
Two common causes for this:
- Events sent without the quality parameters that drive matching (email, phone, fbp, fbc)
- Events not being deduplicated against the pixel during on the same stage.
That being said, audit your event payload first.
DO NOT scale spend on any Meta campaign showing Critical CAPI until match rate is back above 75% because every additional dollar is being delivered to a degrading audience.
All my signals are status Normal, but metric still dropped
In case all your signals are status normal, you can rest assured that your data is fine, and the problem lies on the other various reasons, among most common ones are creative fatigue, audience saturation, market shift, seasonal pattern, or a competitor change.
Act on data with confidence – pause, scale, refresh creative or hold steady, as your data is just fine.
Want to see how RedTrack Pulse work in real life?
Book a demo and we’ll show every step of it, or try it for your self and sign up for a 14 day free trial!