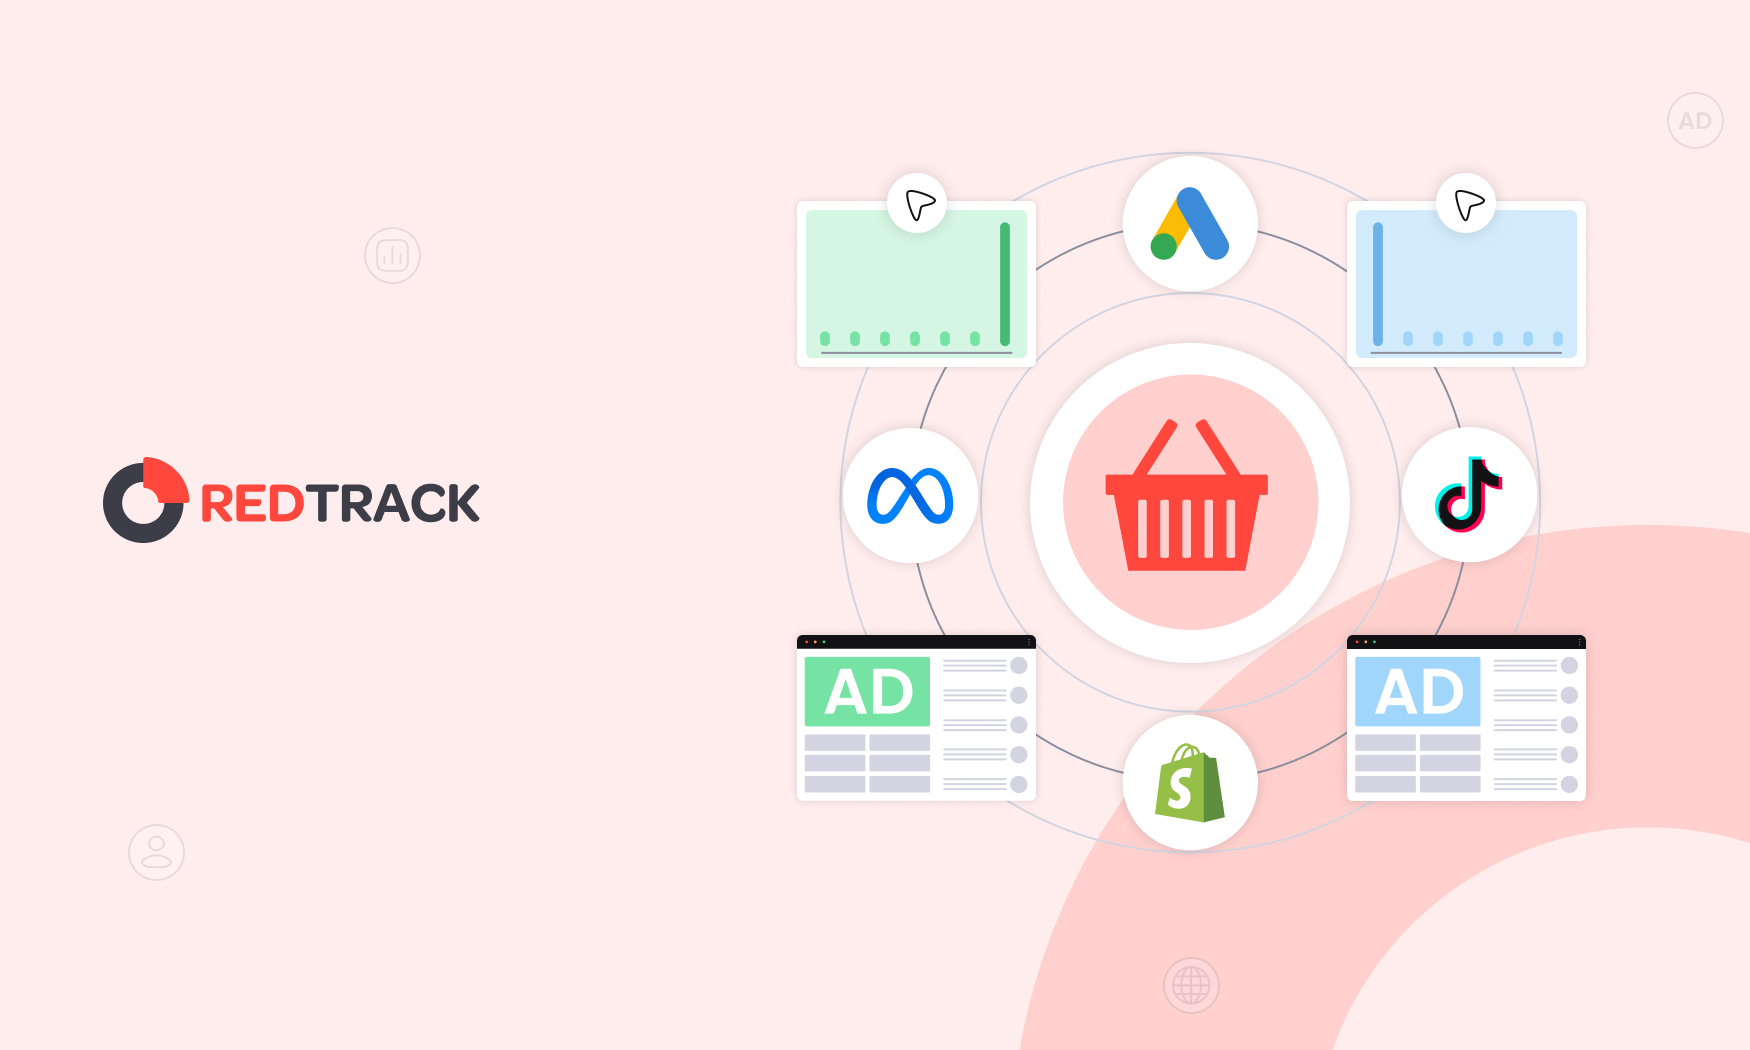
If you’re running ad campaigns across more than two channels, chances are you’re struggling to map out your customer journeys by using only native platform reports. Since each platform can only see the touchpoints that took place on its system, you can never see the cross-channel interactions. You only ever see the ones that happened inside each platform.
Within native platforms, there is simply no way to map out the entire sequence of touchpoints a customer had across multiple channels before they eventually converted.
Now, wouldn’t it be nice if there were a tool or dashboard that could do that? Gather all the touchpoints across your channels and give you the exact customer journey as it happened, and show you an equal number of conversions to your actual purchases?
Imagine that. You see where the customer was initiated (say TikTok), which ads they clicked that nurtured them further on the path (maybe Meta and Google), and then finally,y you see the one that actually delivered the conversion (perhaps email).
That’s exactly what a tool like RedTrack can do.
In this use ca,se we explain why native ad platforms can’t track entire customer journeys, and how you can use RedTrack to finally reveal the actual sequence of touchpoints behind every one of your conversions.
Challenge: Why Your Native Ad Platforms Can’t Reveal Customer Journeys
The one-sentence answer to why native ad platforms can’t reveal customer journeys is this: Ad platforms operate in silos.
On top of that, they’re also designed to only measure their own performance, not help you understand how your campaigns throughout the funnel perform.
This creates multiple problems when it comes to tracking attribution and customer journeys.
1. Ad Platforms Are Isolated, Customer Journeys Are Multi-Channel
First, every ad channel operates on its own individual system and measurement logic. It only sees the clicks, impressions, and conversions that happen on their platform, not across platforms.
But when you’re running ad campaigns on several channels, chances are your users interact, see, and click ads on all of them. However, neither one knows which other channels they interacted with before the conversion happened. That’s the first roadblock that prevents you from seeing the full customer journey in native ad platforms.
Second, Meta, Google, and TikTok all use different attribution windows and conversion definitions,s which prevents you from seeing accurate conversion numbers.
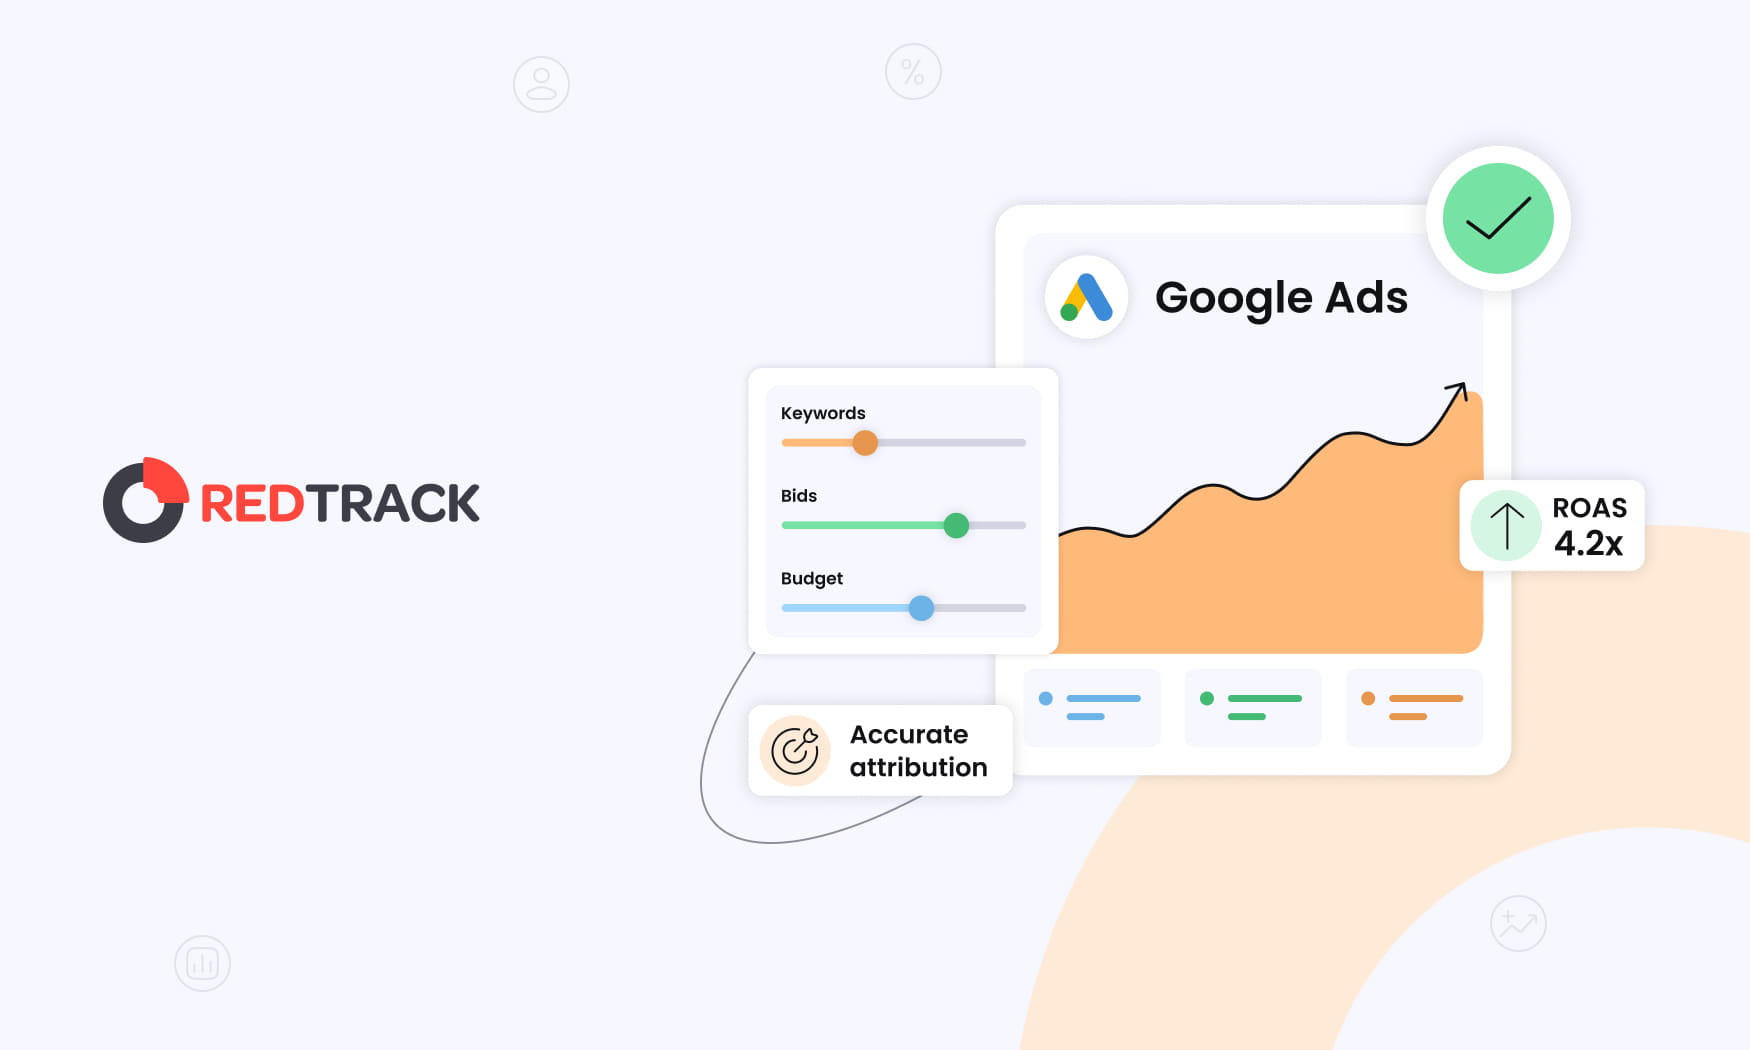
- Google Ads uses its own data-driven attribution and a 30-day click default conversion cycle
- Meta Ads uses last-touch and 7-day click, 1-day engage-through, and 1-day view conversion cycle
- TikTok uses last-touch and 7-day click, 1-day view-through conversion cycle
Ultimately, each platform wants to prove its value to advertisers, so if a conversion happens and it falls within any of the above-mentioned windows, the platform will claim it as its own. And that’s why your native ad dashboard reports don’t match up with your backend.
Your backend will show you had 550 sales (conversions). However, your ad platforms might look more like this:
- Google – 390 conversions
- Meta – 340 conversions
- TikTok – 280 conversions
When you add these platform numbers up, they definitely don’t equal your actual sales. The reason is attribution overlap. It’s where multiple platforms rightfully claim one conversion as their own. However, while those conversions are rightfully theirs based on their attribution models and windows, if you apply a uniform model and window across all platforms, there will be inconsistencies.
2. Reports Focus on Last-Touch Reporting, Not Assisted Conversions
The other bigger issue when it comes to customer journeys is that ad platforms are also not designed to uncover assisted conversions, and they make up the majority of the customer journey.
There’s only everyone’s first and last touch. But many interactions take place in between those two.
Most ad platforms favor the last-touch model. Why? Because that’s where the purchase happens, and for businesses, purchases (revenue) are the number one priority.
But that means an ad platform will never be able to tell you the sequence of events and interactions that led to that conversion, which are just as important (if not more so) as the final conversions.
Think about it:
If your user didn’t see the five different ads of your product across multiple channels, would they have gone and searched the product on Google,e which eventually resulted in a purchase?
Probably not – they wouldn’t have remembered you.
Those ads popping up kept your product top of mind. They assisted the final conversion.
Imagine this user scenario:
- A person clicks on a Meta prospecting campaign, which introduces them to your brand and product, and signs up for emails
- Then, a Google brand search captures them a few days later
- Five days later, they received a direct retargeting email, which they converted from
Under the last-touch model, the email looks like the winning channel here. But, without the original Meta prospecting campaign, they never would have signed up and kept considering the product.
The problem media buyers end up with as a result of focusing on last-touch attribution is that they end up not seeing the true value of top-of-funnel campaigns, which are vital for generating new demand.
But in native ad platforms, these campaigns continuously appear “unprofitable”.
The Impact: You Scale Closing Channels & Neglect Discovery Channels
The combination of these two issues then leads media buyers to make decisions that don’t work in their budget’s favor.
Because branded search and retargeting campaigns always look like they’re delivering great results, you naturally assume this is where most of your budget needs to go.
The problem is, these numbers look great because they are skewed to favor last-touch attribution models. But the reality is, you’ll be throwing money into running campaigns for users who would have bought anyway.
When you continue to apply this tactic, over time, here’s what happens to your funnel.”
- Discovery weakens (you are not investing in early awareness campaigns)
- New customer acquisition slows (you keep throwing money towards eyes that already know and see you)
So, wouldn’t it make more sense to allocate that budget to generating new buyers?
Probably, but if you continue using native ad platform reports, you will always be told to do the opposite.
Solution: Independent, Cross-Channel Attribution Tools That See Everything
If you want to track full customer journeys and see exactly which campaigns and ads are responsible for:
- Discovering your brand and product
- Nurturing the customer through the consideration phase
- Closing the deal and delivering a purchase
You need an independent, cross-channel attribution tool that lives outside your ad platforms.
Tools like RedTrack sit in this category, and they give you three things that ad platforms can’t.
1. The Full Sequence of Touchpoints (Across Every Ad Platform)
Unlike ad platforms, which mostly rely on third-party cookies and browser-side tags and pixels to pick up and record attribution, RedTrack uses server-side (S2S) tracking.
Now, browser-side tracking is a huge issue because it’s more fragile. The moment a user:
- Haves ad-blockers enabled
- Browses in incognito mode
- Gets caught up in iOS privacy restrictions
- Switches devices throughout their journey
A gap is created, so the ad platforms don’t capture entire journeys.
So when some of these touchpoints get unrecorded (and they do often), attribution and conversion credit get attributed to the platform that was lucky enough to be the last, not all the platforms that contributed.
On the other hand, when you use server-side tracking tools, they don’t depend on browsers. In RedTrack’s case, click and conversion data are passed directly from your server to RedTrack’s dashboard. This means you finally get the entire customer journey, with all its touchpoints across channels, captured.
When you use independent attribution tools like RedTrack:
- Ad blockers and browser restrictions don’t interfere with signals
- Customer journeys are never broken, even when the user switches from desktop to mobile
- The system applies one consistent metric system for attribution windows and conversion rules across all your channels,s so data can be compared fairly
What you finally get is a complete sequence and order of events for every customer journey.
2. Independent Attribution (No Conflict of Interest)
While ad platforms have a huge incentive to present themselves in the best light, independent attribution tools are there to serve your best interests.
The reality is, ad platforms have a financial interest in showing up as the best-performing channel. If they show you they’re contributing the most to your revenue, you’ll continue to purchase and run ads on their platform.
Independent tools like RedTrack, on the other hand, are there to help you gather and view all your ad platform conversions from a neutral standpoint.
So when you connect your RedTrack to all your ad channels via Conversion API, you finally get clean, accurate conversion and attribution reports.
RedTrack:
- Removes duplicated conversions
- Applies one attribution methodology across all your platforms
- Gives equal weight to every channel
- Shows the full customer journey and not just the last click
- Reveals what’s actually happening, not what appeals most to the ad platforms
This means you finally have one source of truth you can rely on to make budget and campaign optimization decisions based on honest data.
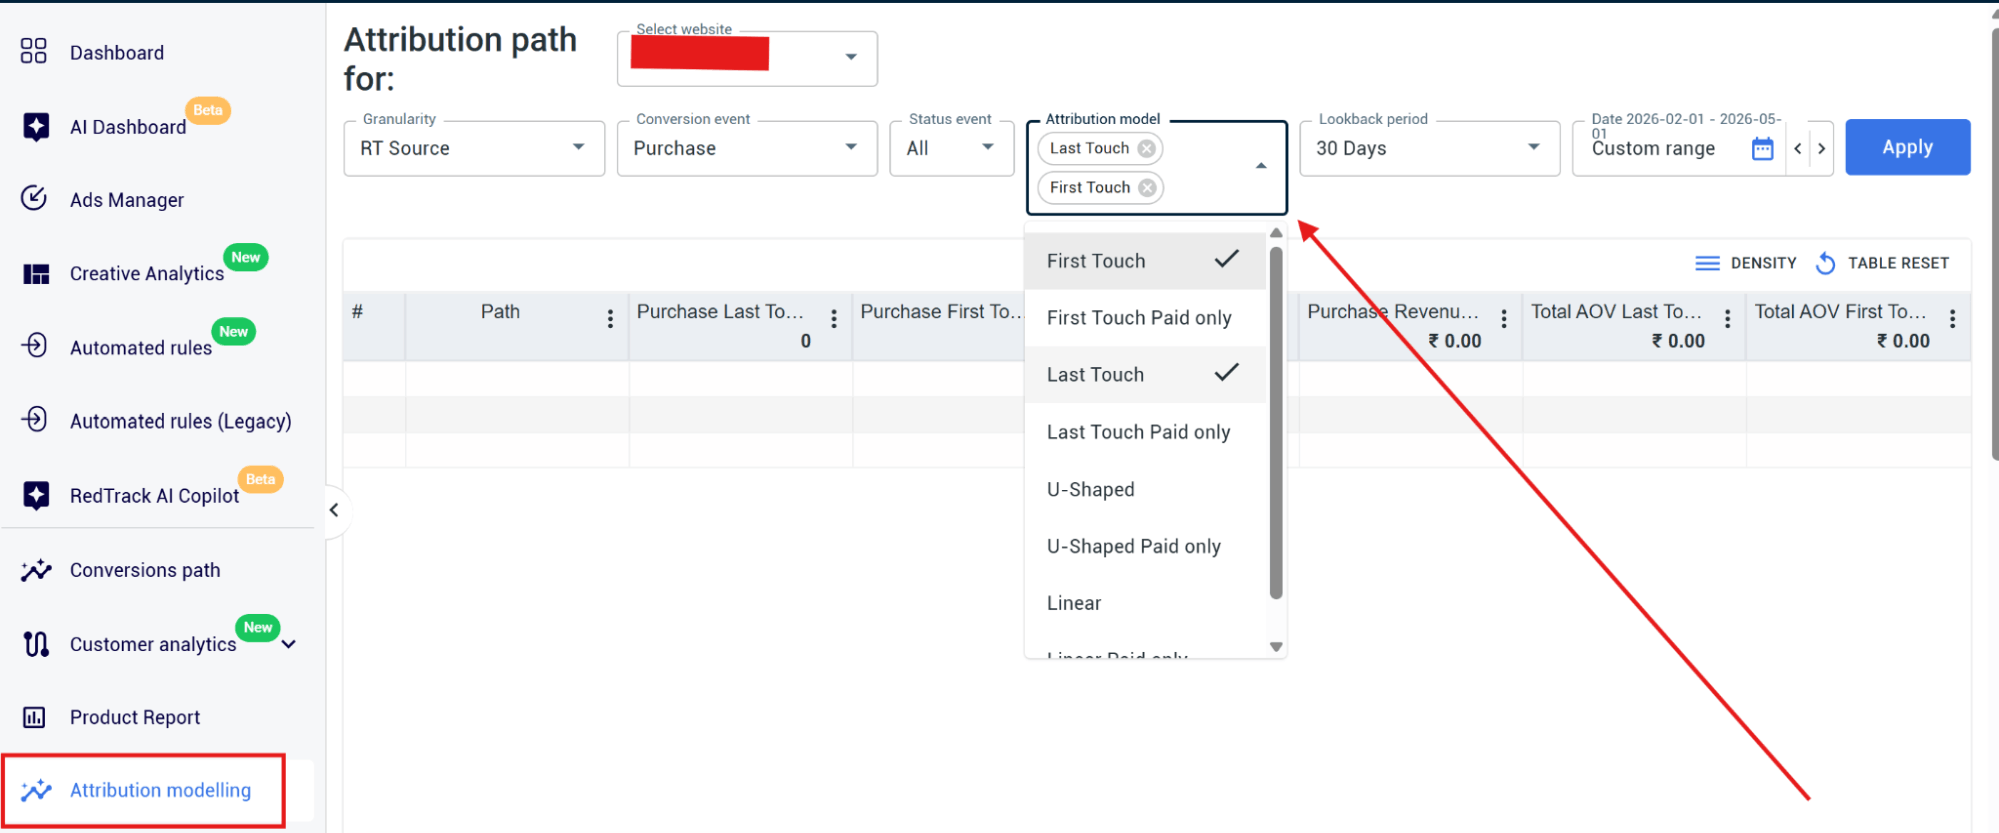
3. Multiple Attribution Models (Understand Your Campaigns Better)
Finally, not only does an independent tool apply one attribution logic to all your conversion data, but RedTrack also comes with the option of putting your data through multiple attribution models.
This is a valuable feature because different attribution models uncover different insights about your campaigns.
- First-touch – Uncovers and gives credit to the ad that introduced the customer to your brand or product
- Last-touch – Uncovers and gives credit to the ad that finally delivered the purchase
- Linear – Shows and gives equal credit to all the touchpoints that happened in a customer journey.
- Time decay – Reveals and gives most credit to the touchpoints that took place closer to the purchase.
- U-shaped – Dedicates the majority of credit to first and last touchpoints,s with the remainder distributed to assisting ads.
Having the option to apply all these different models can help get answers to bigger questions you have around how your overall marketing campaign strategies work together to deliver revenue.
How RedTrack Reveals the Full Customer Journey
To track the full customer journey within RedTrack, you need to use and combine two reports:
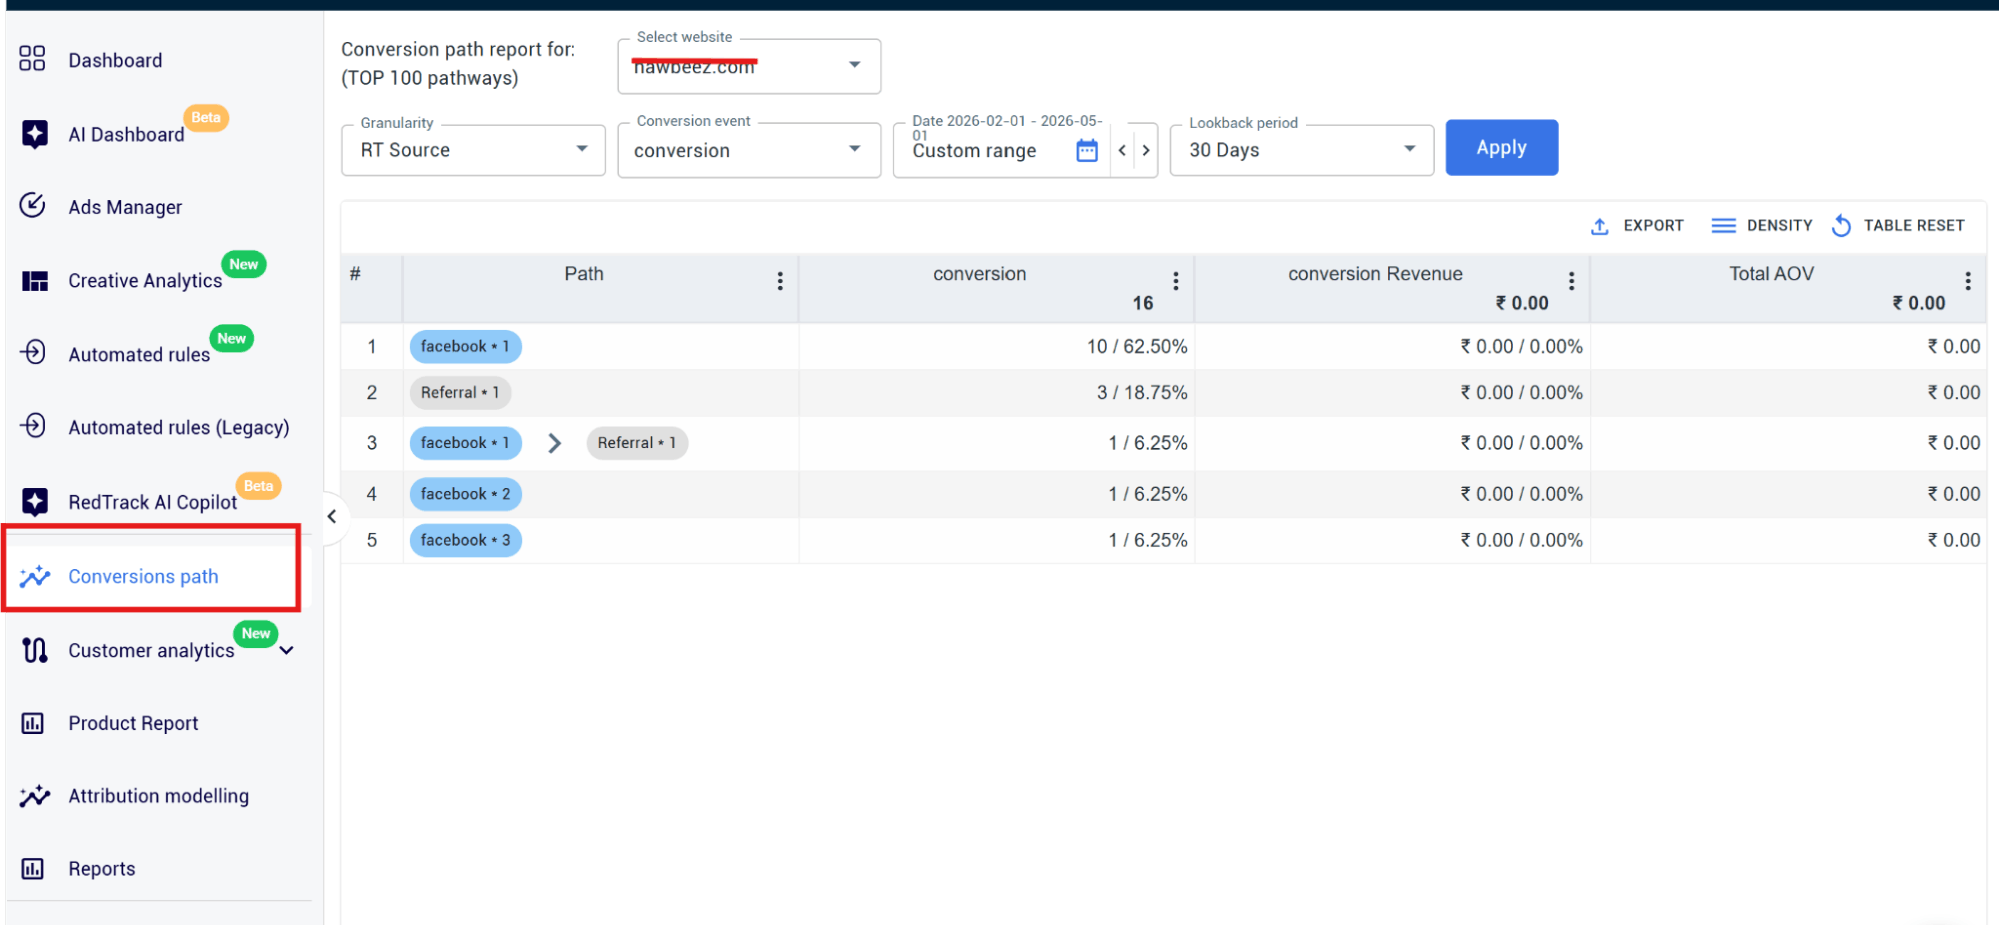
1. Conversion Path Report
The first is the Conversion Path report, which shows the exact sequence of events that took place for every conversion. So when Meta and Google both claim a conversion, you’ll finally have a report that tells you which one interacted with the customer when.
This report will show you:
- The channel that introduced the customer
- The full collection re-engagement touchpoints
- The channel that closed the conversion
- All the timestamps and click data for the entire customer journey
2. Attribution Modelling Report
The second report is the Attribution Modelling Report. Once RedTrack has the entire customer journey mapped out and stored in the Conversion Path Report, you can then use that data to apply different attribution lenses.
The fact that you can apply multiple attribution models and compare them side-by-side in RedTrack is what helps you understand your customer journeys at a deeper level.
For example, when you compare:
- First-touch vs. Last-touch – You see which channels create demand and which ones capture it.
- Last-click vs. Linear – You see which channels assist conversions
- First-click vs. Linear – You see which channels purely drive awareness and which ones contribute throughout the entire journey
It also lets you make more informed decisions when it comes to which ads should be scaled based on your strategic and funnel focus.
These are all things you cannot do within native platform reports.
How to Set Up Cross-Channel Customer Journey Reporting in RedTrack
To set up cross-channel customer journey reporting in RedTrack, follow the steps below.
Step 1: Add the website and install the universal tracking script in RedTrack
- Go to Brands and select New from scratch
- Fill in the mandatory fields and click on Save
- Go to Websites and select New
- Enter Website name and select the brand from the drop-down
- Then, enter the Website URL (this might be the link to your landing page or e-commerce site)
- Click Save to generate the script
- Copy the generated universal tracking script and paste it into the <head> tag of your website code
Step 2: Connect to your ad platforms
- Go to Sources or Integrations
- Add all the traffic channels/sources you work with
- For each integration:
- Authorize the API connection
- Enable cost sync
- Map your accounts
Step 3: Set up campaign URLs with RedTrack’s tracking parameters
- When you create a campaign in RedTrack, the platform will automatically assign parameters (Click ID, Campaign ID, Ad ID, Source Identifiers, etc.)
- That URL will look like this: https://yourdomain.com/?rtkcid=12345&utm_source=facebook
Note: Make sure you ONLY use these RedTrack-generated URLs across your ad channels. If some traffic uses RedTrack URLs and some don’t, your customer journeys will become fragmented, assisted conversions will disappear, and your overall attribution accuracy will drop.
Step 4: Configure conversion events
- In RedTrack, go to Conversion Tracking
- Create conversion events that make sense for your business. These might include:
- Purchase
- Lead
- Signup
- Trial activation
- Demo booked
- Deposit
- Subscription renewal
- Pass revenue and event values for:
- Revenue
- Margin
- Product ID
- Customer type
- Order value
- Currency
Note: This is what lets the attribution models compare volume, profitability, and customer quality.
Step 5: Test the attribution flow is working
Before you go and run a Conversion Path and Attribution Modelling reports, make sure you test that the attribution flow is working properly.
- Take the following dummy trial steps:
- Clicking on a Meta ad
- Leaving the site
- Returning through Google
- And converting
- Then check your RedTrack dashboard to see if the exact customer journey you took is reflected in the report, and also:
- Revenue is assigned
- Cost sync is working
Step 6: Run the Conversion Path report
- Go to the Conversion Path report
- You should see something like this:
- Meta → Google Search → Direct → Purchase
- Here, you can analyze customer journey length, including:
- How many touchpoints are needed for a conversion to take place
- Which products have longer consideration cycles
- If high AOV purchases demand more interactions
Step 7: Run the Attribution Modelling report
- Go to the Attribution Modelling report
- Set your date range
- Select the conversion event
- Choose an attribution model
Let RedTrack Show You The Entire Customer Journey
Native ad platforms can’t give the entire sequence of touchpoints that took place in every one of your customer journeys, but RedTrack can.
Ad platforms give you their side of the story. And when you’re running ads on three, four, or more channels, what you end up with is fragmented and conflicting data you can’t make any sense of.
But if you buy ads or make ad budget decisions, you need to see the entire cross-channel journey for every one of your purchases. That’s the only way you can make confident decisions that will reflect positively on revenue, long-term.
Because RedTrack gives you an independent data collection and reporting layer, you can finally view the full path behind successful conversions, find out which ads are the initiators, the closers, and which are helping move customers along the funnel (assisting ads).
So instead of pumping cash into the channels that are driving existing demand, you’ll know which ads are also generating awareness and new demand.
Want to see how the tool works in the real world?
Book a demo call with one of our people or get started on your own by signing up for RedTrack’s 14-day free trial.