
As a performance marketer or media buyer you’re likely running dozens of ads across multiple campaigns and platforms.
And as each campaign comes to an end, you’ve got to clients or managers to answer to. The questions they want you to answer clearly are:
- Which ads are actually making money?
- Where should we be boosting budgets to keep growing?
The problem? The data your ad platforms provide can’t give you a straight answer to the first, and the insights you do have will give you a misleading answer to the second.
You’re struggling with the following: Even though ad platform dashboards tell you your ad campaign performance is strong, the backend purchase data you have is saying otherwise.
So, naturally, you are confused and probably stressed because the data you have isn’t making sense. And the reason it’s not making sense is that ad platforms were never designed to uncover ad-level profitability, just like they weren’t designed to uncover assisted conversions.
In this use case, we explain why using ad platforms to understand profitability doesn’t work, and we tell you how tools like RedTrack can help you overcome this challenge. That way, you can answer those two questions with confidence for every client and stakeholder, and make smarter budget allocation decisions that guarantee growth!
Challenge: Why Ad Platforms Can’t Reveal Which Ads are Profitable
The straight-up answer to this question is: ad platforms were built to optimize delivery, not decipher profitability.
On top of that, there are three other core reasons why ad platforms can’t help in this space.
#1 Fragmented Data Across Platforms That Don’t Sit on One Ecoysystem
If you want to get a clear picture of your profitability at the ad level, you need to connect two pieces of data:
- Ad spend (housed on your ad platforms)
- Conversion data (housed in your store or backend)
So the first problem you run into is that these two data sets don’t naturally live in one system, so they’re not integrated.
On top of that, the numbers and data you get from all your platforms can’t be easily matched up because each ad platform uses its own set of:
- Attribution models
- Conversion windows
- Definitions of what counts as a conversion
And even if you try to manually compile a profitability performance report, your results become unreliable because you’re trying to compare data using different measurement systems.
#2 Delivery Metrics Don’t Equal Profit Metrics
The second big issue is that delivery metrics, which platforms like Meta, Google, and TikTok provide, don’t equal profit metrics.
These ad platforms focus on maximizing engagement within their ecosystems, so they prioritize things like:
- Impressions
- Clicks
- CTR
- CPC
- Reach
While all these numbers will tell you how well your ads perform in the outside world, they don’t tell you what happens after users click those ads. Did they actually click buy? That’s what you want to know.
There is absolutely no way for you to know, at an ad level, what your purchase revenue, profit, or CPA is, based on actual purchases.
So even if you have an ad campaign that shows:
- High CTR
- Low CPC
- Overall strong engagement
… it can still be losing your client money, not making it.
Knowing your ads are being seen and people are engaging with them is great, but that doesn’t mean all those viewers are converting.
#3 Real Distribution Can’t be Found in Campaign Averages
The third issue, which is just as problematic, is that ad platforms give you campaign-level metrics (like ROAS), which are useless when you need to make decisions on individual ads.
For example, you might see a solid campaign average result, but:
- One ad might be generating all the revenue
- Five ads might be generating none
On paper, the average masks the real situation, and you keep putting money into all the ads (the ones that work and the ones that don’t), when in reality, it would make better financial sense to boost the one ad that’s generating conversions and scale back or rework the ones that aren’t.
If you’re super keen, you might try to break down performance to the ad level manually, but then you realize that by the time you clean and collate that data:
- The optimization window is long gone
- You’ve continued to waste budget on ads that aren’t working
- You’ve come up with a good optimization decision, but it’s too late
It’s simply not a viable option, especially if you’re running multiple campaigns for multiple clients across many platforms.
Solution: Switch to a Cross-Channel Tool That Shows Profitability (at Ad Level)
If you want to understand profitability at the ad level and know exactly which ads are bringing in money to your clients, you need to move away from platform-native reports and secluded ecosystems.
Instead, you need to turn to a cross-channel conversion tracking tool and conversion attribution tool like RedTrack, which:
- Connects you ad spend with actual purchase data
- Breaks and delivers performance right down to the individual ad level
- Centralizes all your attribution, conversion, and profit data in one need system
So instead of relying on fragmented data that you need to collate and clean, you get a unified view that uncovers and displays profitability right down to the ad level, in real time.
What You Can Do When You Get Your Hands on a Unified Reporting Layer
When you get on board with a cross-channel tool like RedTrack, you get a unified reporting layer that can show you:
- Purchase revenue, CPA, as well as profit per ad
- How ads compare across campaigns and platforms consistently
- Which ads are winning, and which ones are sore losers
And when you have this info in the palm of your hand, every day and hour, you can make fast optimization decisions for the short term, and more impactful budget allocation decisions for the long term.
How to Use RedTrack & Find Out Which Ads Are Actually Making Money
There are two ways you can use RedTrack to analyze and grasp profitability at the ad level:
- Creative-level analysis (you look at the visual level))
- Report-level analysis (you look at the hierarchical level)
And if you want to be super thorough and get the full picture, you will do both.
Method 1: Creative Analytics
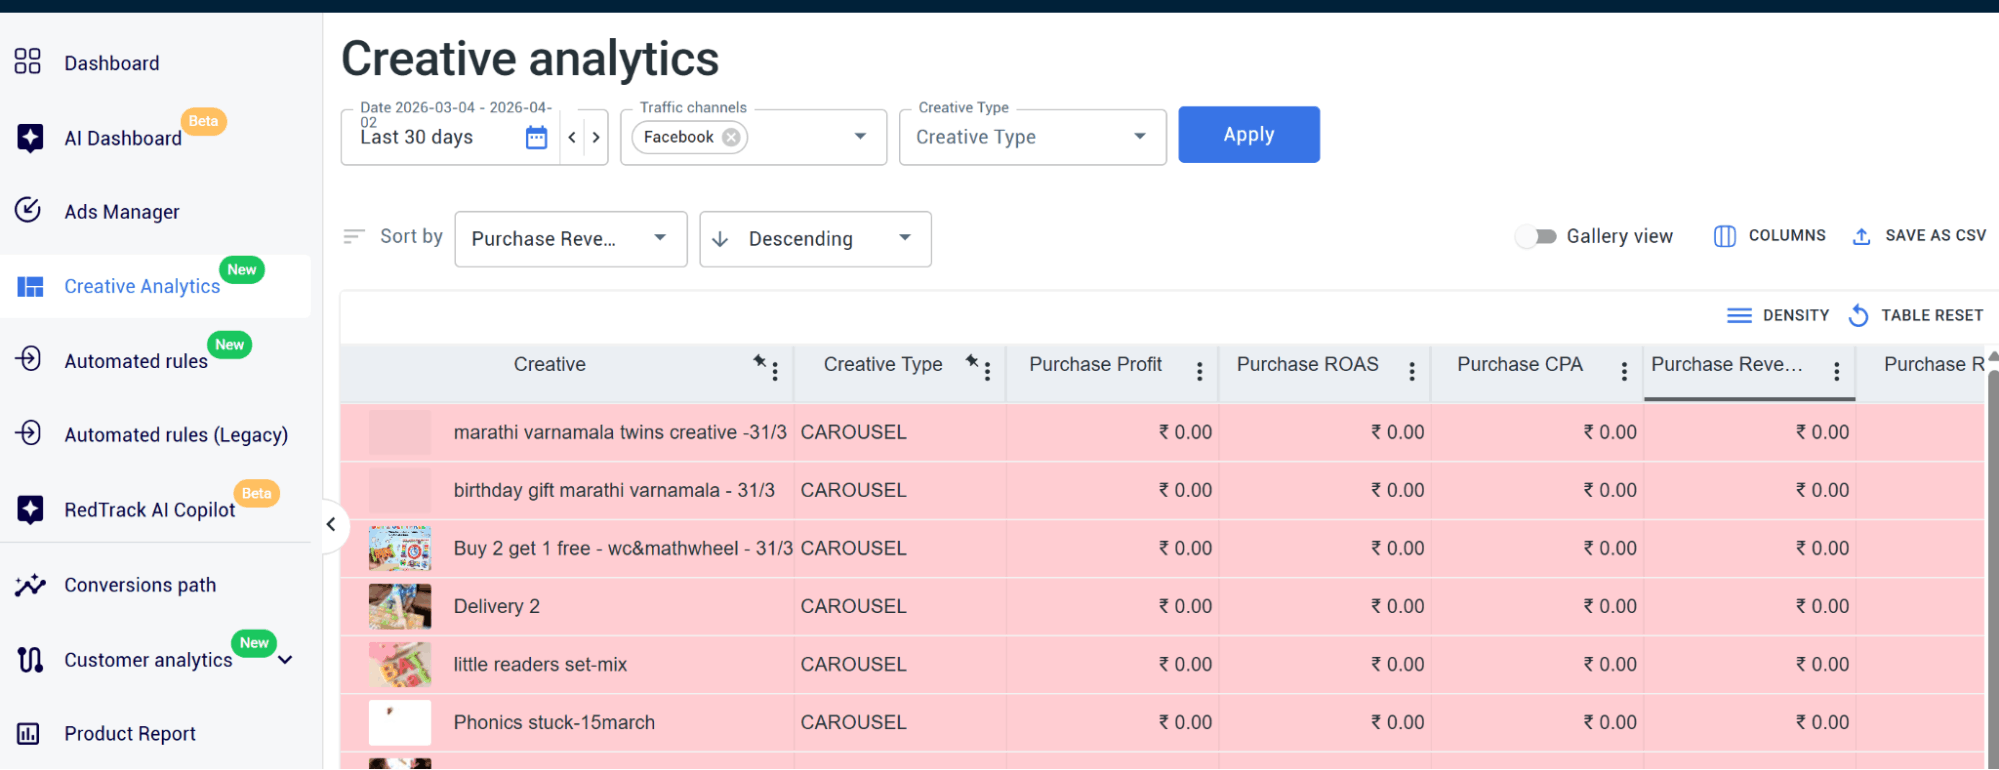
As the name suggests, this first method evaluates your ad performance based on the actual ad creative.
What this analysis gives you is the image, video, or carousel alongside its performance metrics:
- Purchases and purchase CPA
- Revenue
- Profit
- ROI
How to Set Up Creative Analytics Analysis in RedTrack
When you log into RedTrack, take the following steps.
Step 1: Connect your ad account
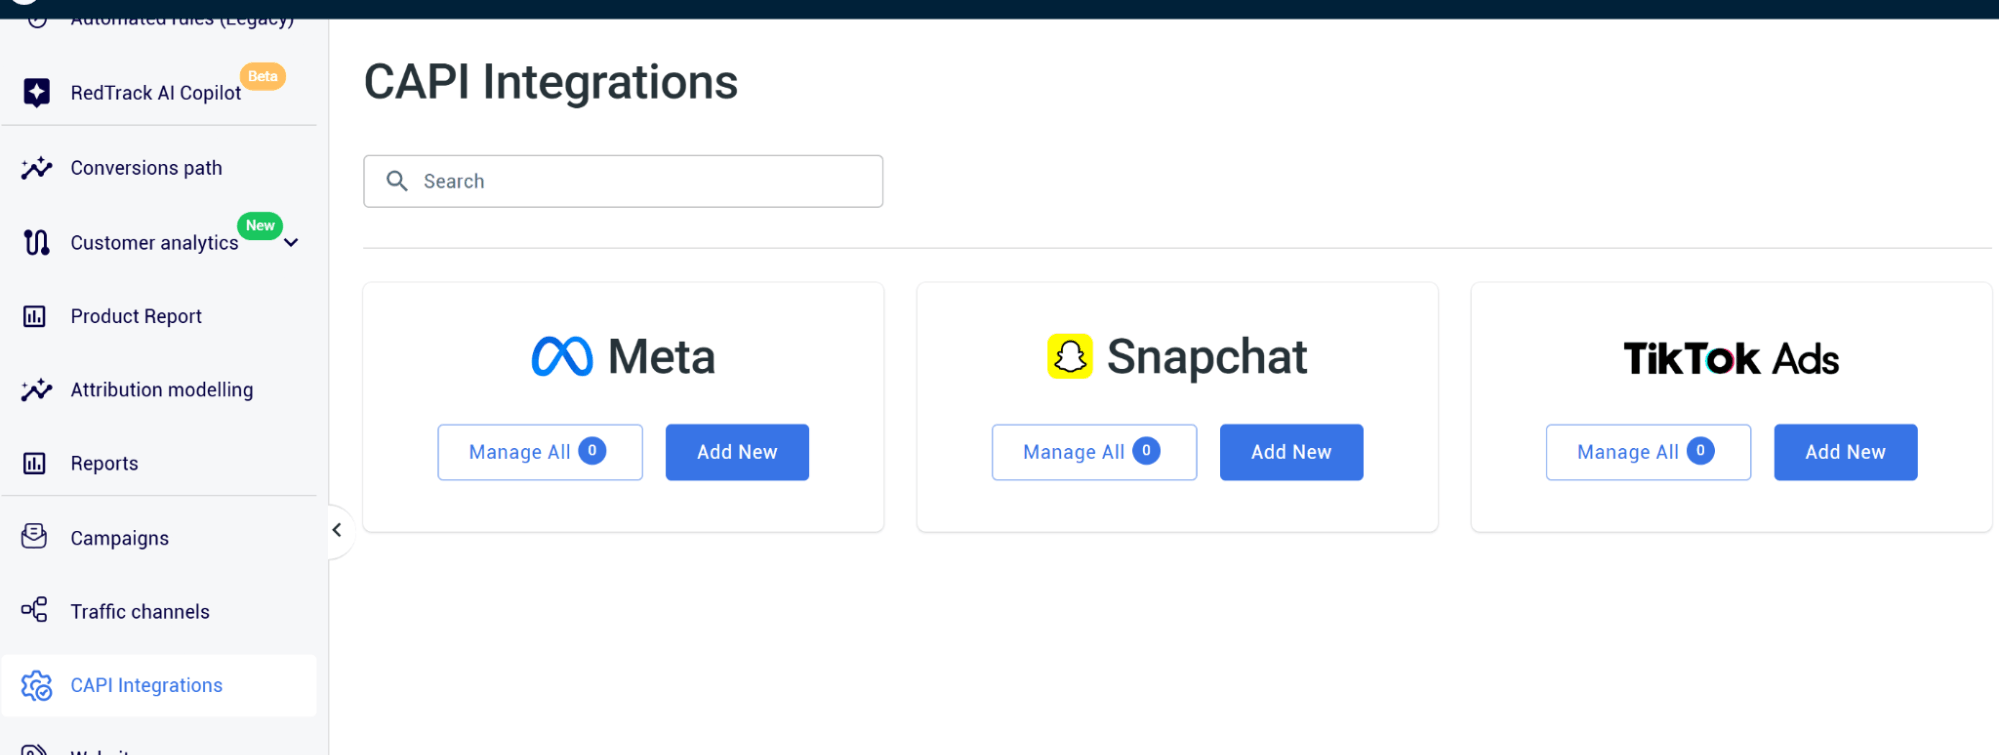
- Go to Integrations in the left-hand navigation
- Select your ad platform (for example, Meta)
- Click Connect Account and complete the authorization
When you’ve completed this first step, you cratives will start syncing automatically.
Step 2: Open and Set Up Creative Analytics
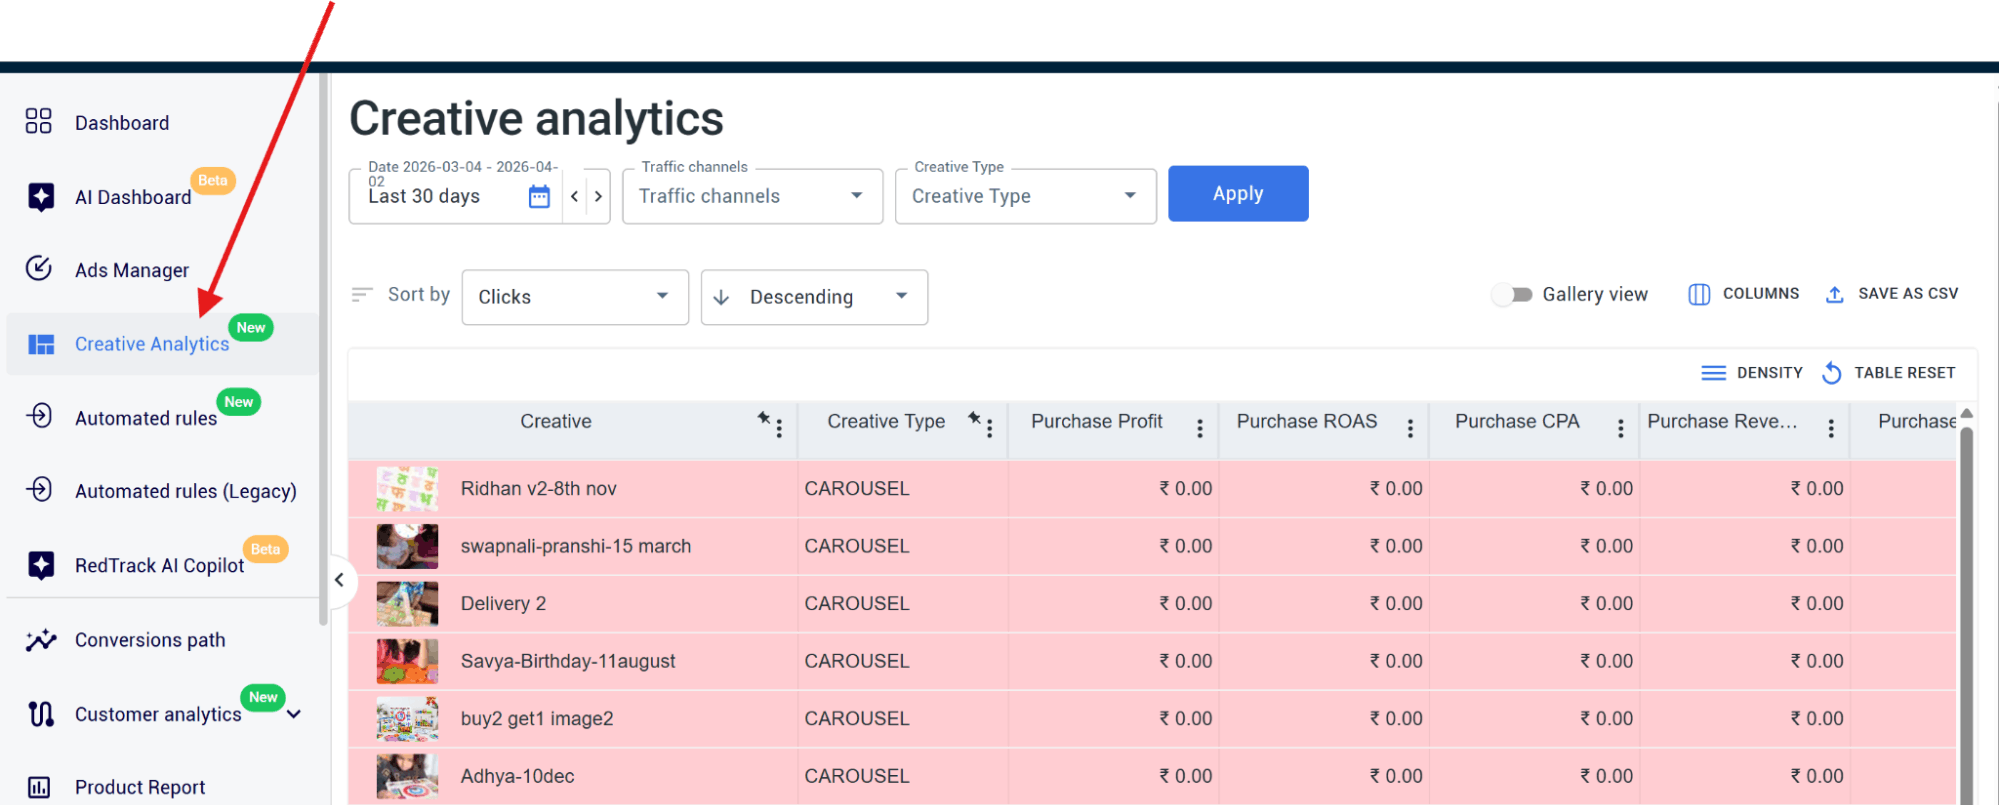
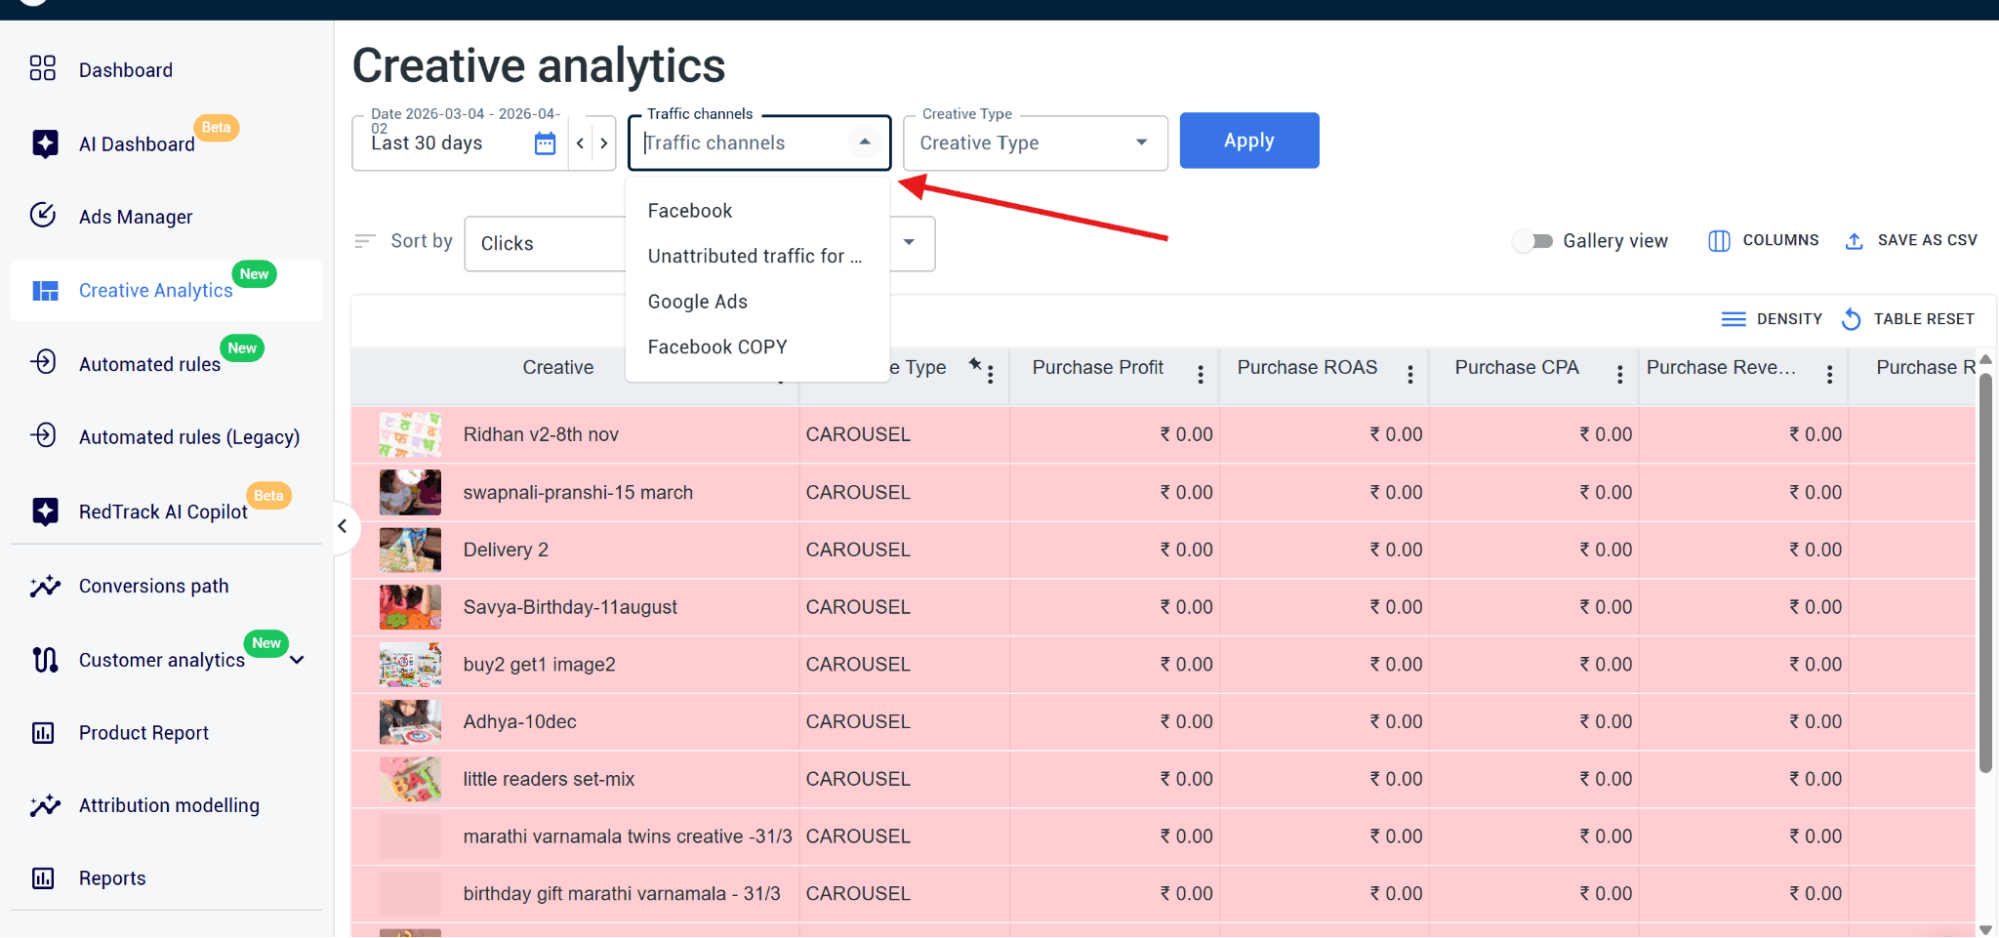
- In the left-hand navigation, click on Creative Analytics (this will open a table with all synced creatives)
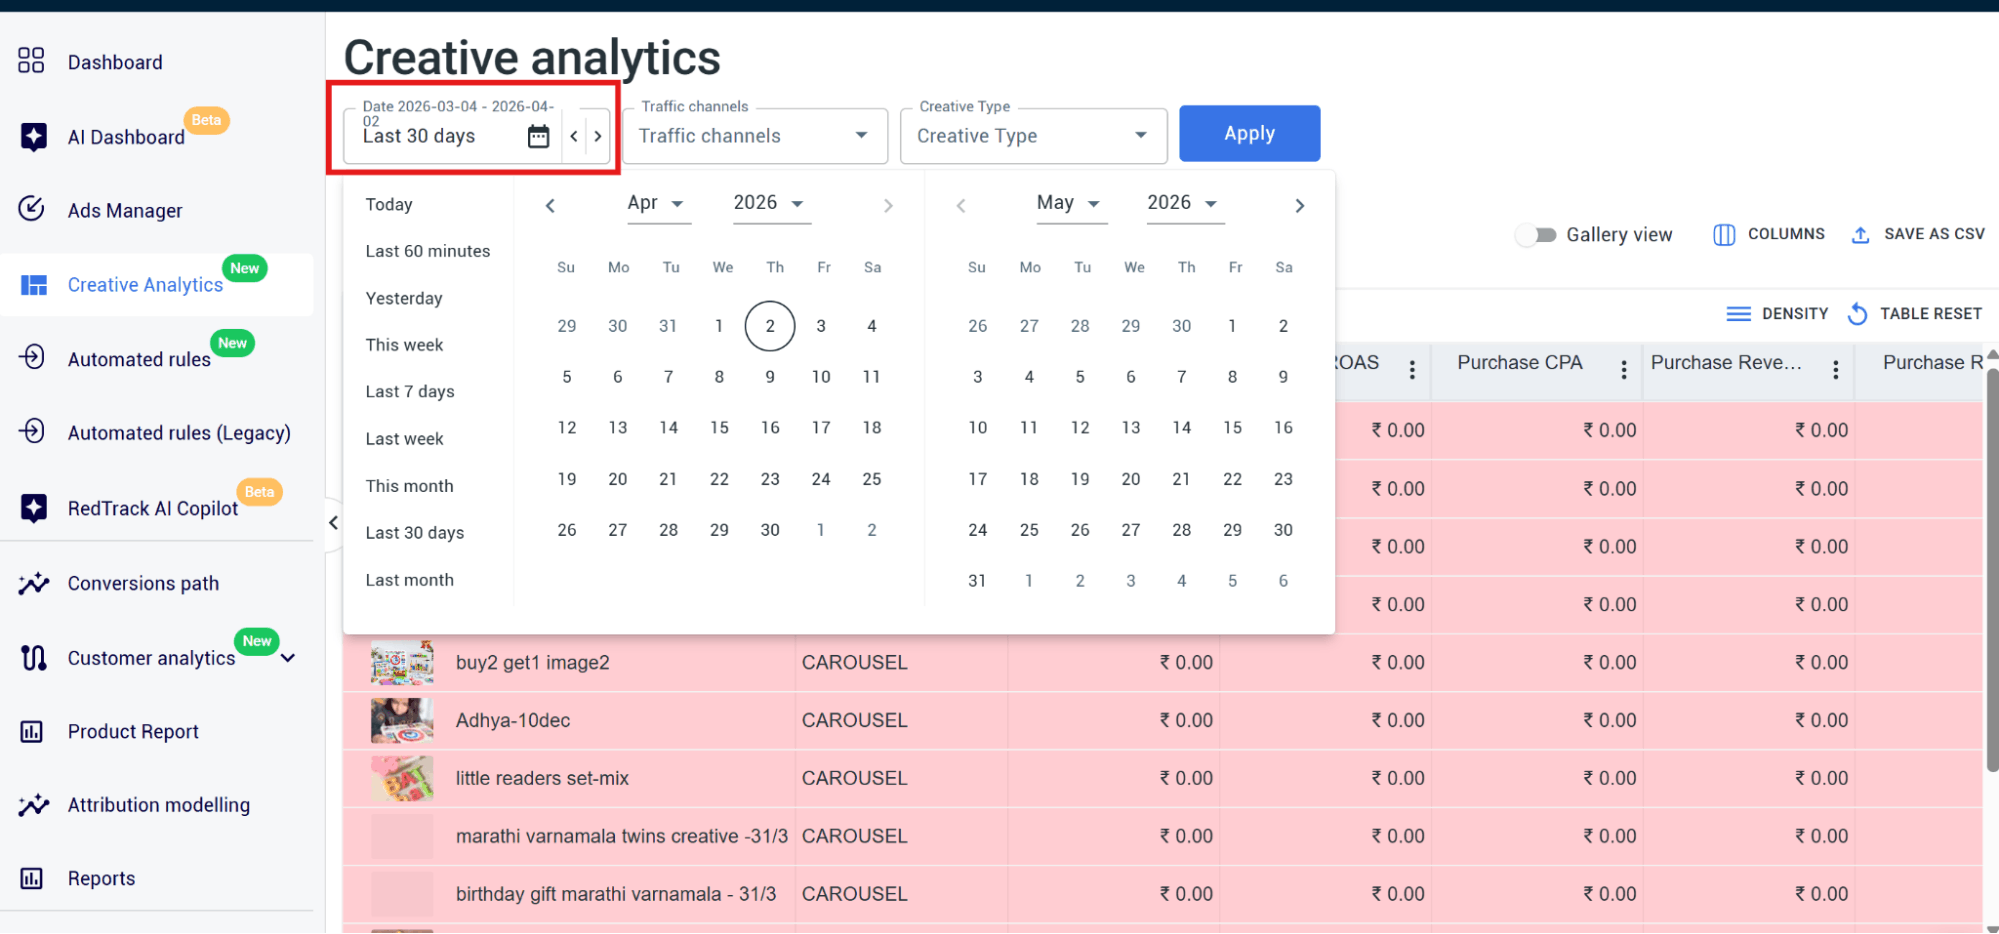
- Set your date range using the Date Picker in the top right corner
Step 3: Add profitability metrics
Next, set the Traffic channels:
- In the top right corner, click on Columns
- Enable the following:
- Purchase
- Purchase CPA
- Purchase Revenue
- Purchase Profit
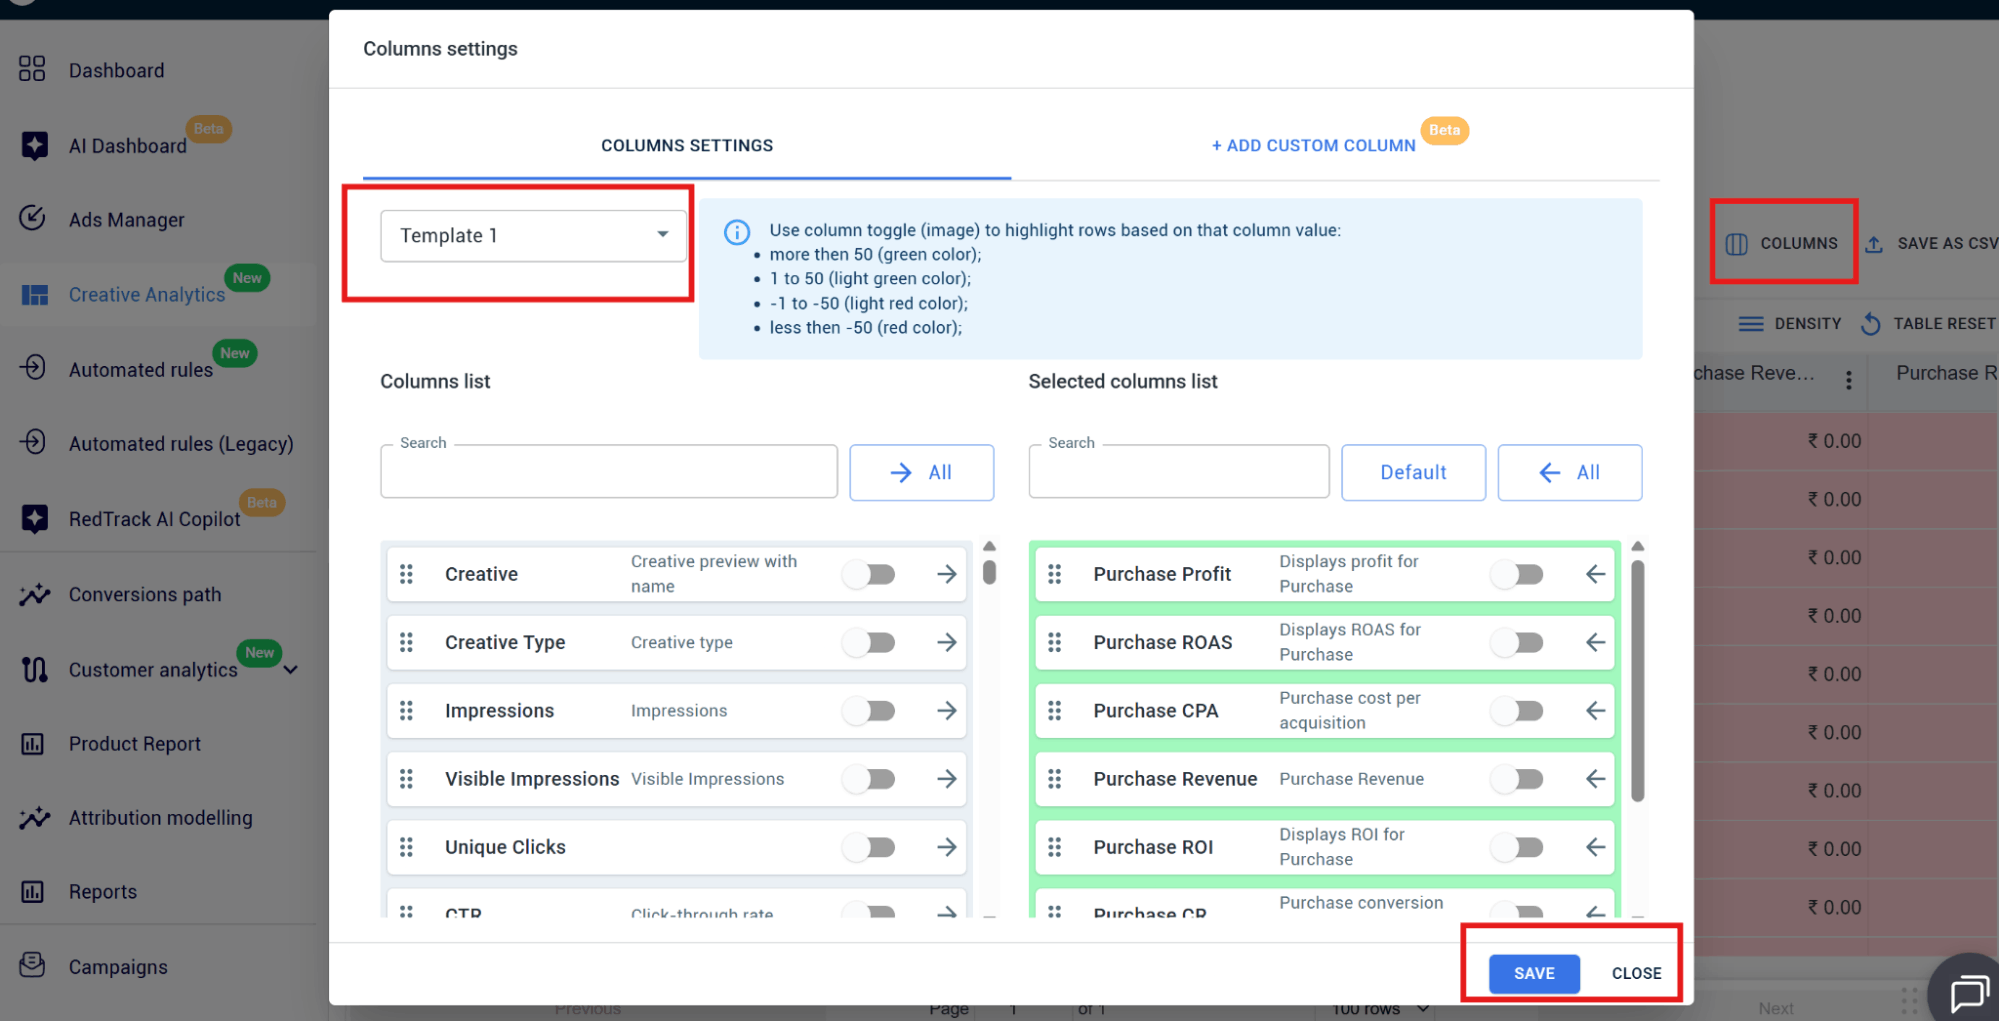
- Click Save (the table will update)
Step 4: Filter your results
- Use the Traffic Channel filter to isolate certain platforms
- Use the Creative Type filter to view between:
- Image
- Video
- Carousel
Step 5: Sort to find winners & losers
- Click on the Purchase Profit column header
- Select between:
- Sort descending (this will display your winners, or the highest profit creatives, first)
- Sort ascending (this will display your losers, or lowest profit creatives, first)
Step 6: Review & optimize ads and budget
Now that you have all the data neatly tied up, you can look at two things:
- Ad spend vs. purchase profit
- Purchase count (for volume validation)
Use the insights you get to identify which creatives are clearly your top performers that deserve to be scaled, and which ones need to be reworked because they are not driving consistent revenue.
Method 2: Reports Analysis
This second method focuses on answering a crucial question: Where in my campaign structure is actual performance coming from?
Some performance marketers might prefer this method because it:
- Mirrors the actual UI flow
- Prioritizes profitability metrics over default views
- Once set up, it makes the analysis process repeatable in under a minute
How to Set Up Report Analysis in RedTrack
When you log into RedTrack, take the following steps.
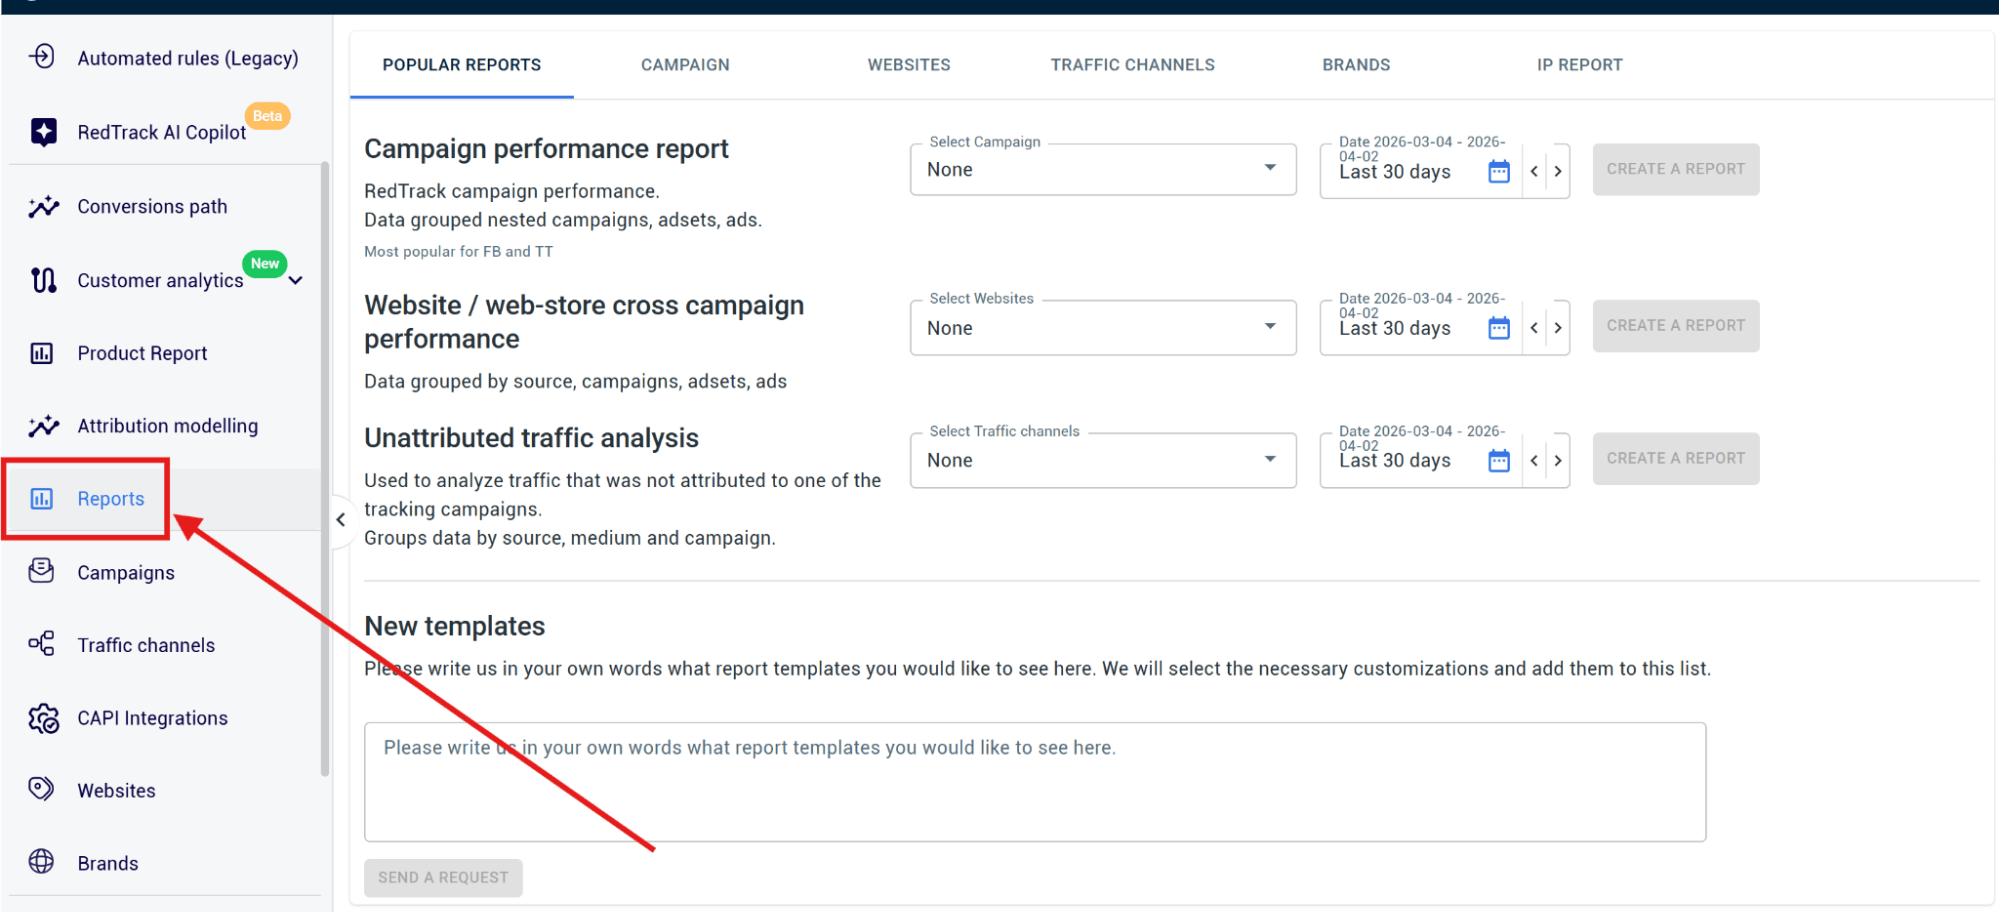
Step 1: Open Reports
- In the left-hand navigation, go to Reports
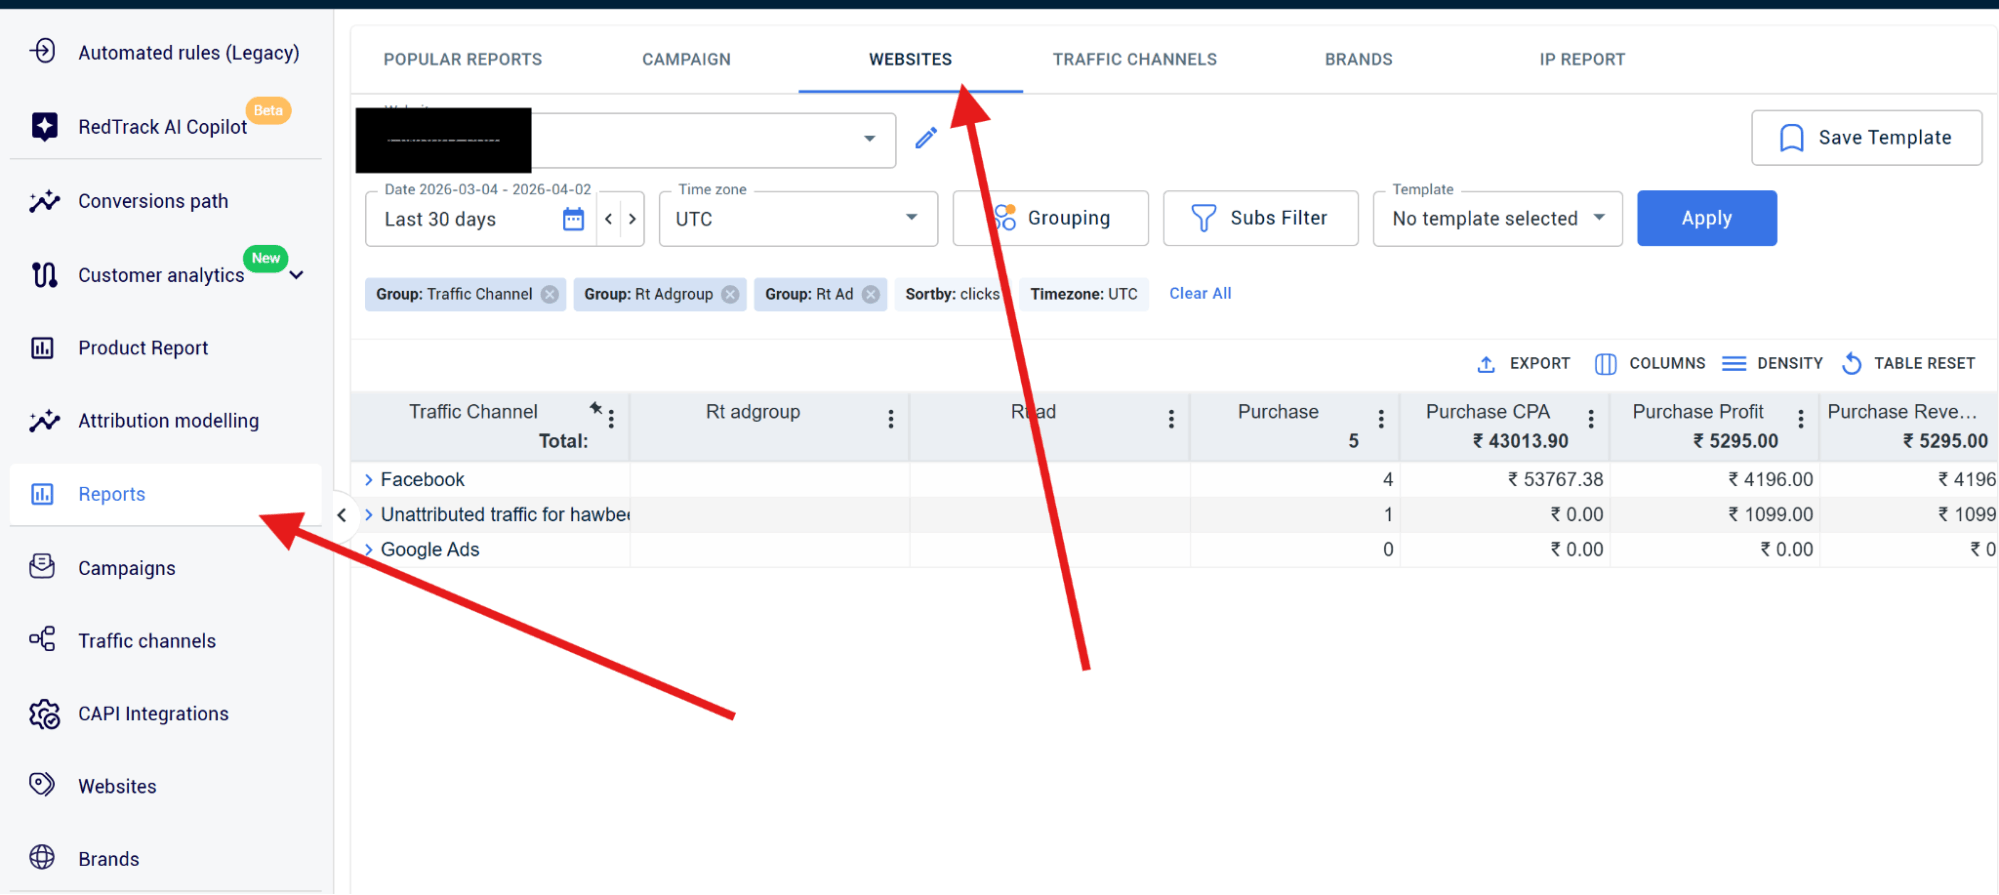
- At the top of the screen, select the Websites tab
Step 2: Select your data source
- Go to the Website/Brand dropdown in the top left corner
- Select the store you want to analyze
Step 3: Select the date range & timezone
- In the top right corner, select your date range
- Then set the timezone to match your ad platform
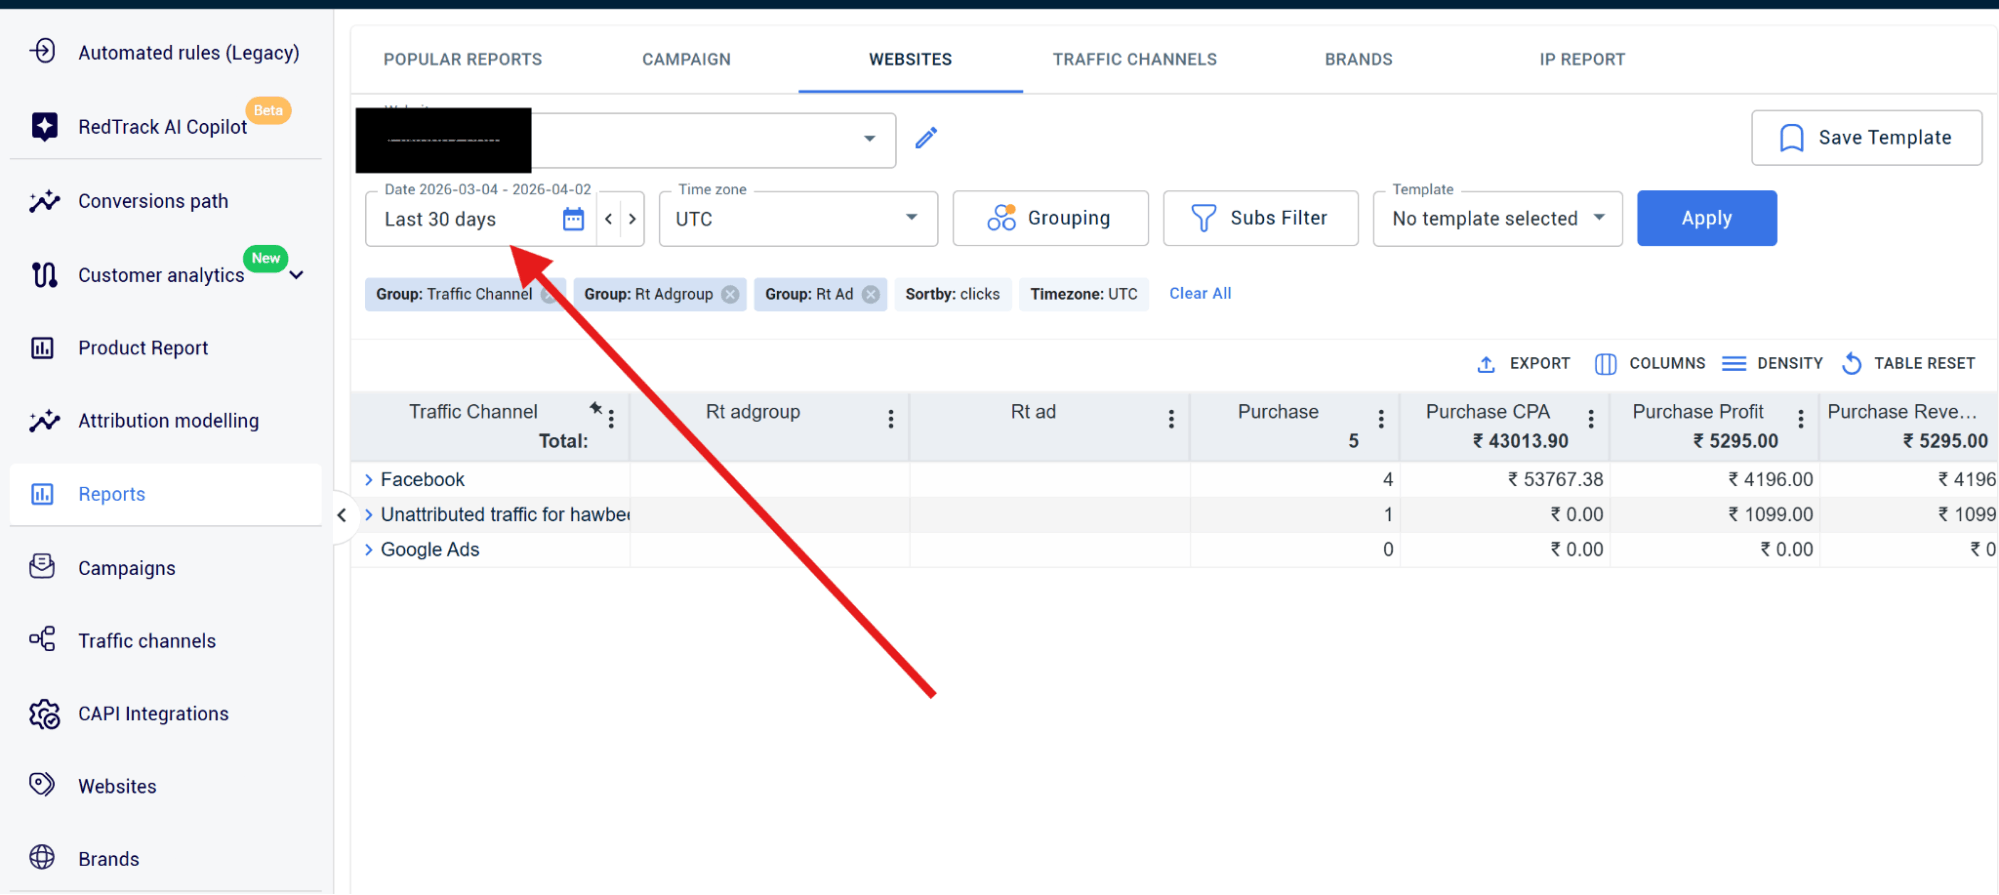
Step 4: Configure grouping
- Click on Grouping
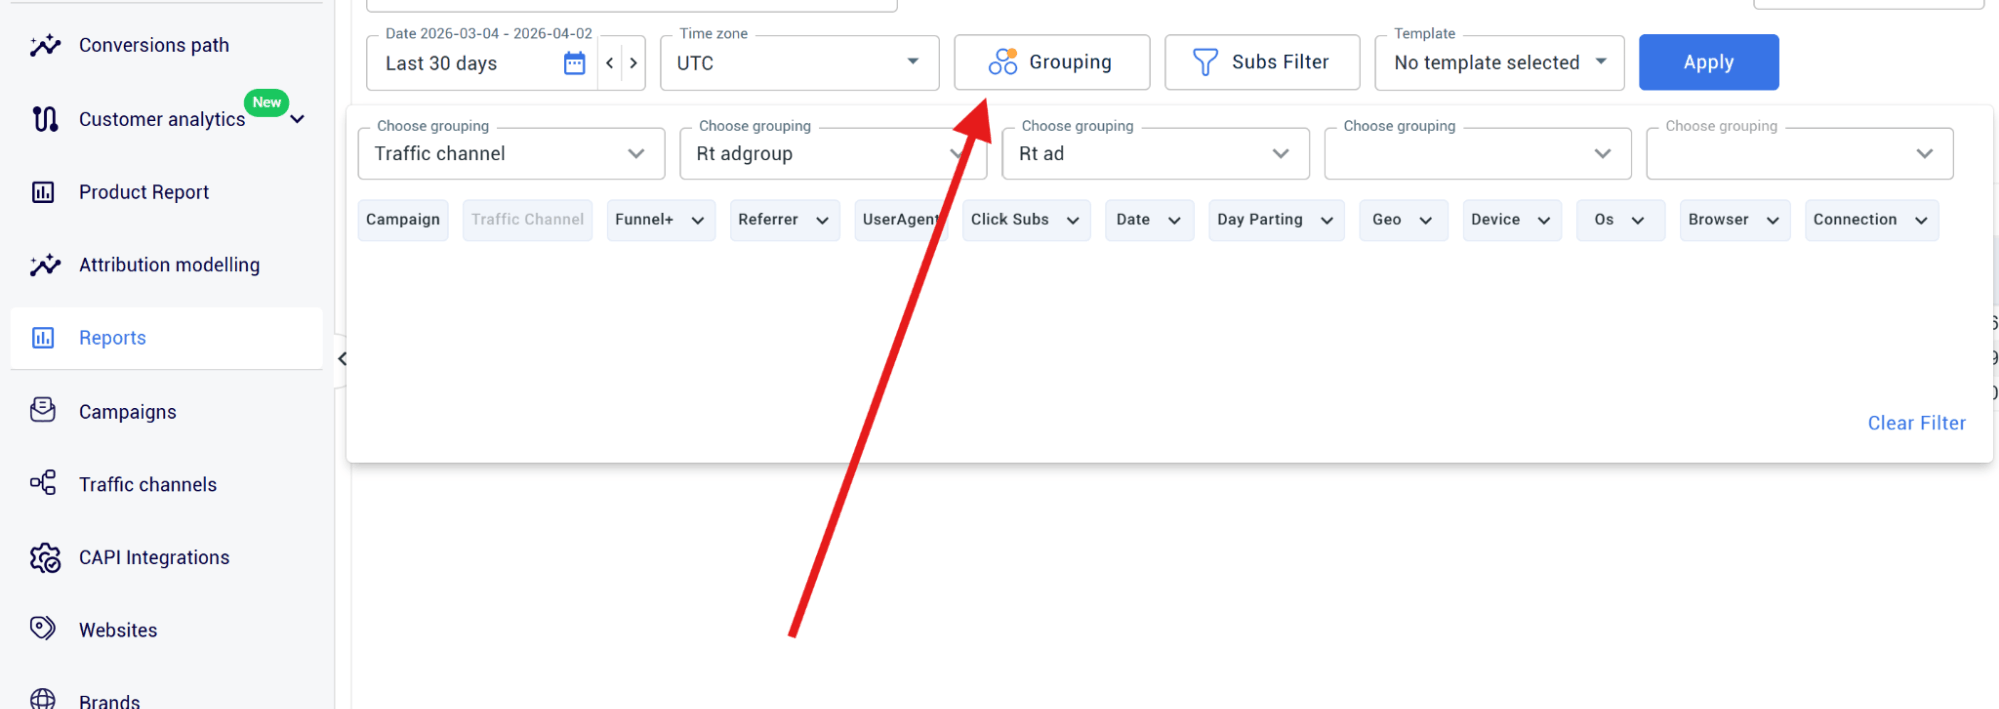
- Add your dimensions in this exact order:
- Traffic Channel
- Rt Adgroup
- Rt Ad
- Click on Apply
You’ll now have a collapsible hierarchy displayed in a table.
Step 5: Add your profitability metrics
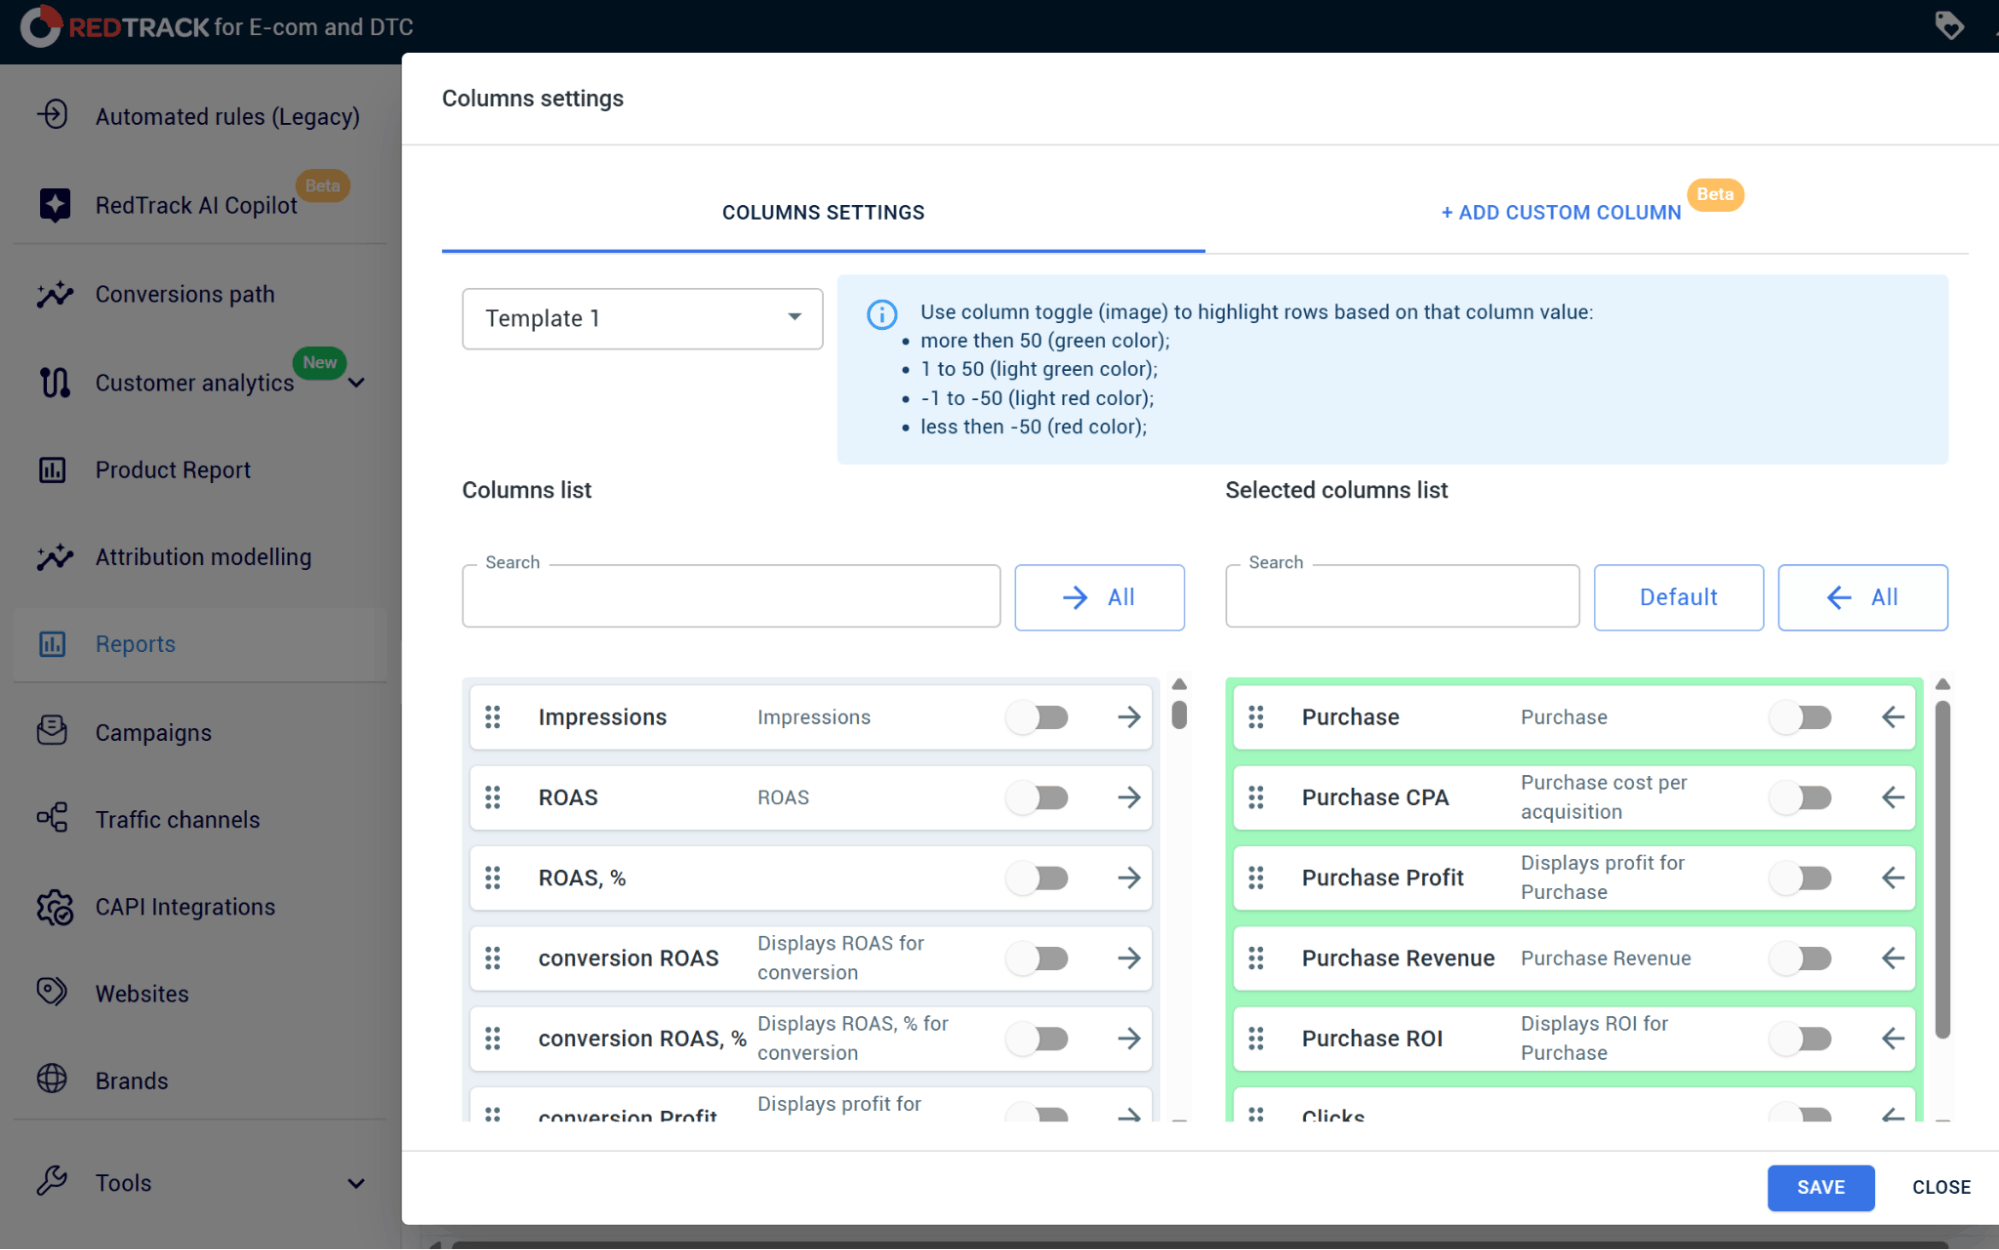
- Click on Columns and enable the following:
- Purchase
- Purchase CPA
- Purchase Revenue
- Purchase Profit
- Click Apply
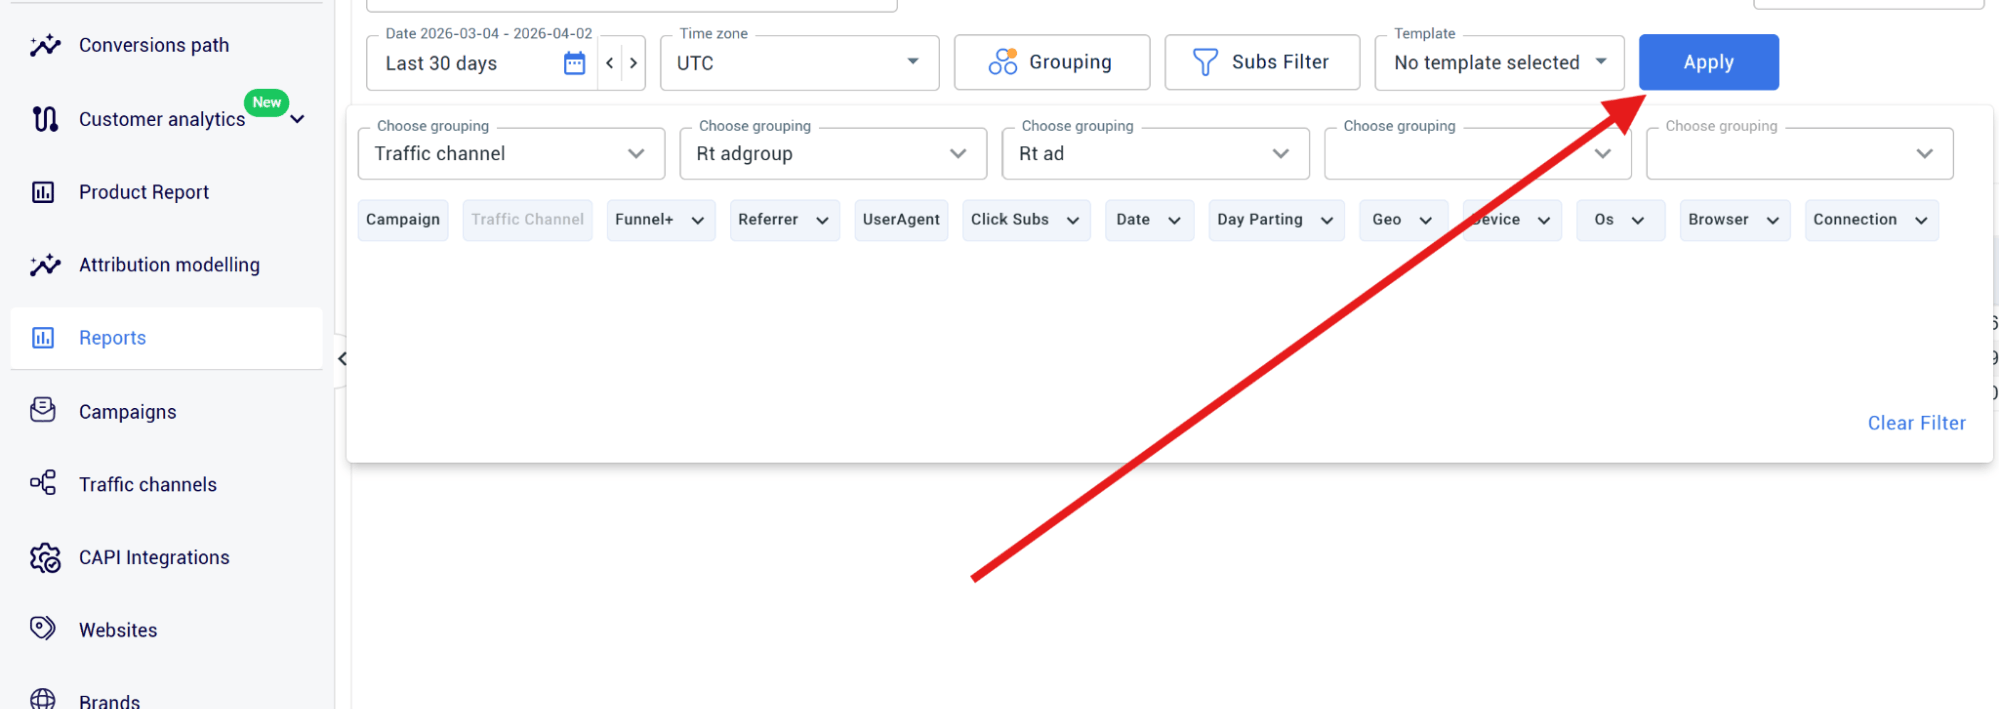
Step 6: Expand and analyze your hierarchy
- To expand ad groups, click on the arrow next to Traffic Channel
- To expand individual ads, click on the arrow next to Ad Group
At each level, you’ll be able to review two things:
- Purchase CPA
- Purchase Profit
Step 7: Spot your problem areas
Work your way from top to bottom to:
- Find the channels that display the worst CPA or the lowest profit
- Then expand to find the weakest ad group
- And then drill down to individual ads
When you do this, you’ll know exactly which ads are:
- Dragging your performance down
- Driving profit results
Step 8: Save your setup to use again, and again
- In the top right-hand corner, click Save Template
- Give your report a name so you can recognize it in the future
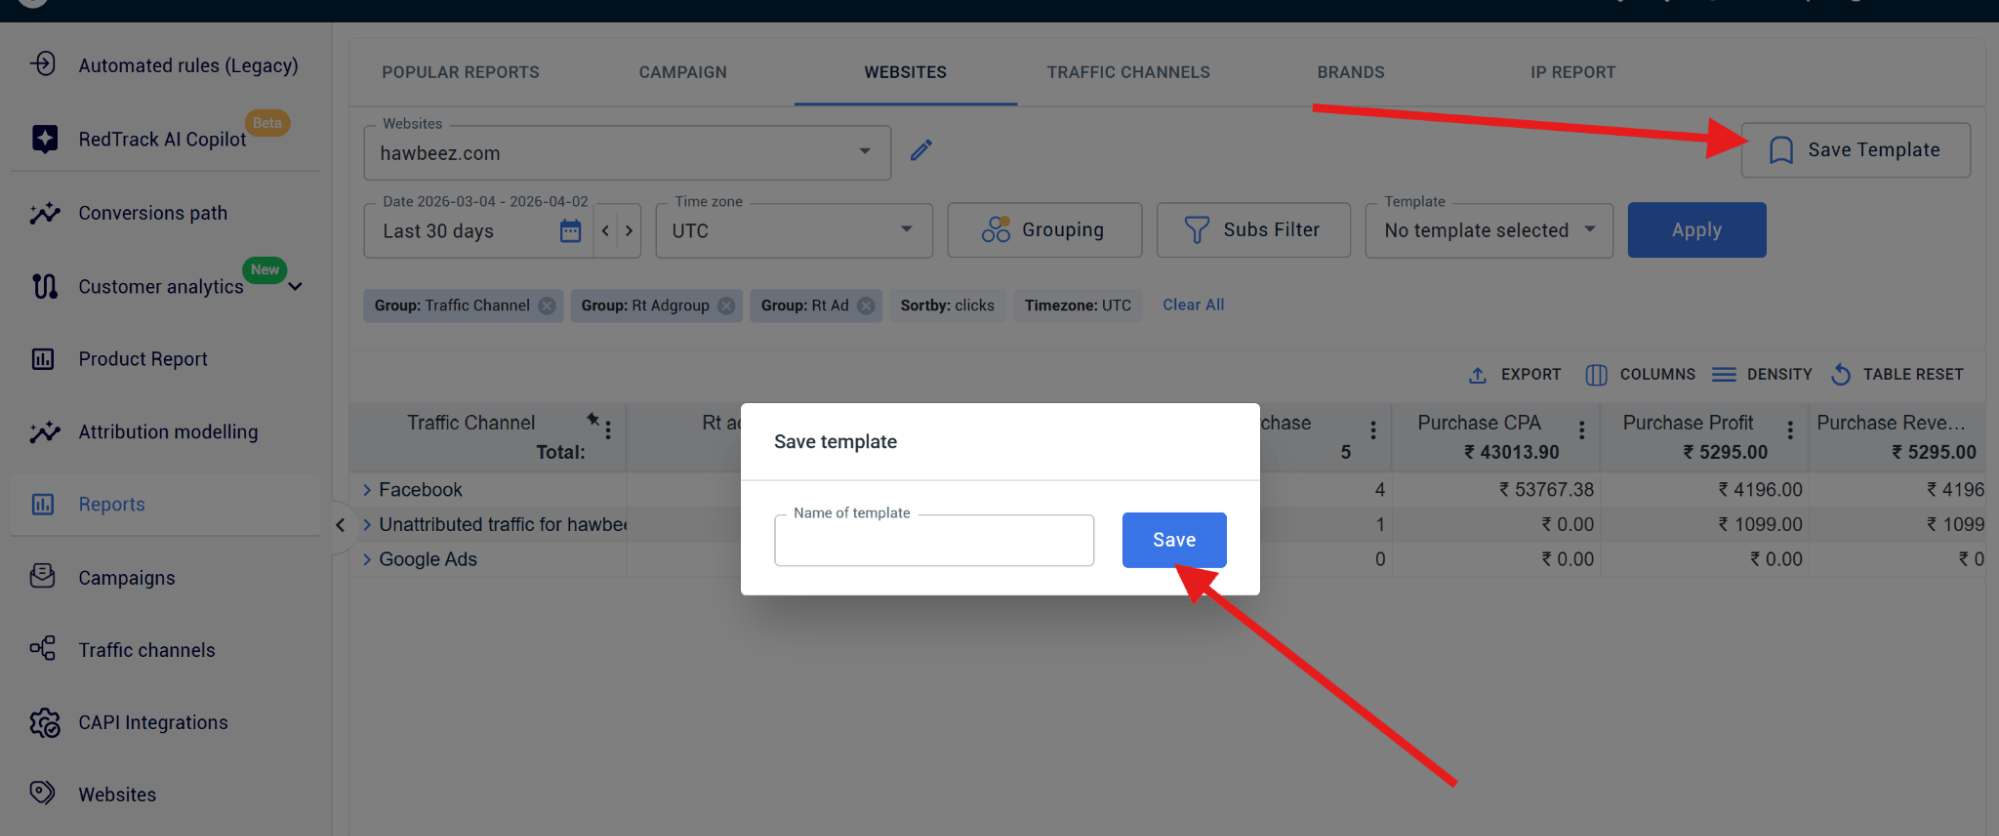
The next time you want to revisit the same report:
- Open Reports
- Load the template you saved by name
- Click Apply


