
Customer cohort analysis helps you understand what happens after the initial conversion event. It gives you a clearer picture of how different customer groups behave, and this is where the most important insights lie. Customer engagement, retention rates, and customer lifetime value rarely show up in top-level metrics, even when those numbers look healthy.
When you look at your entire customer base as one group, very different behaviors get blended together. However, new users from different marketing campaigns, channels, or time periods do not move through the customer lifecycle in the same way. Some continue using it and may upgrade to higher subscription plans, while others lose interest after a few days. Without cohort analysis, those differences are easy to miss, especially once conversion volume increases.
This guide walks you through conducting a customer cohort analysis step by step. We’ll show you how to structure your analysis, what to look for, and how to use cohort insights to reduce churn rates.
How to Conduct Customer Cohort Analysis in RedTrack
RedTrack’s cohort analysis runs on real customer data, not those sample guesses you get from Google Analytics. So, if you want reports you can actually trust, you need to set things up right from the start. Here’s how to analyze customer cohorts:
1. Define Your Goal
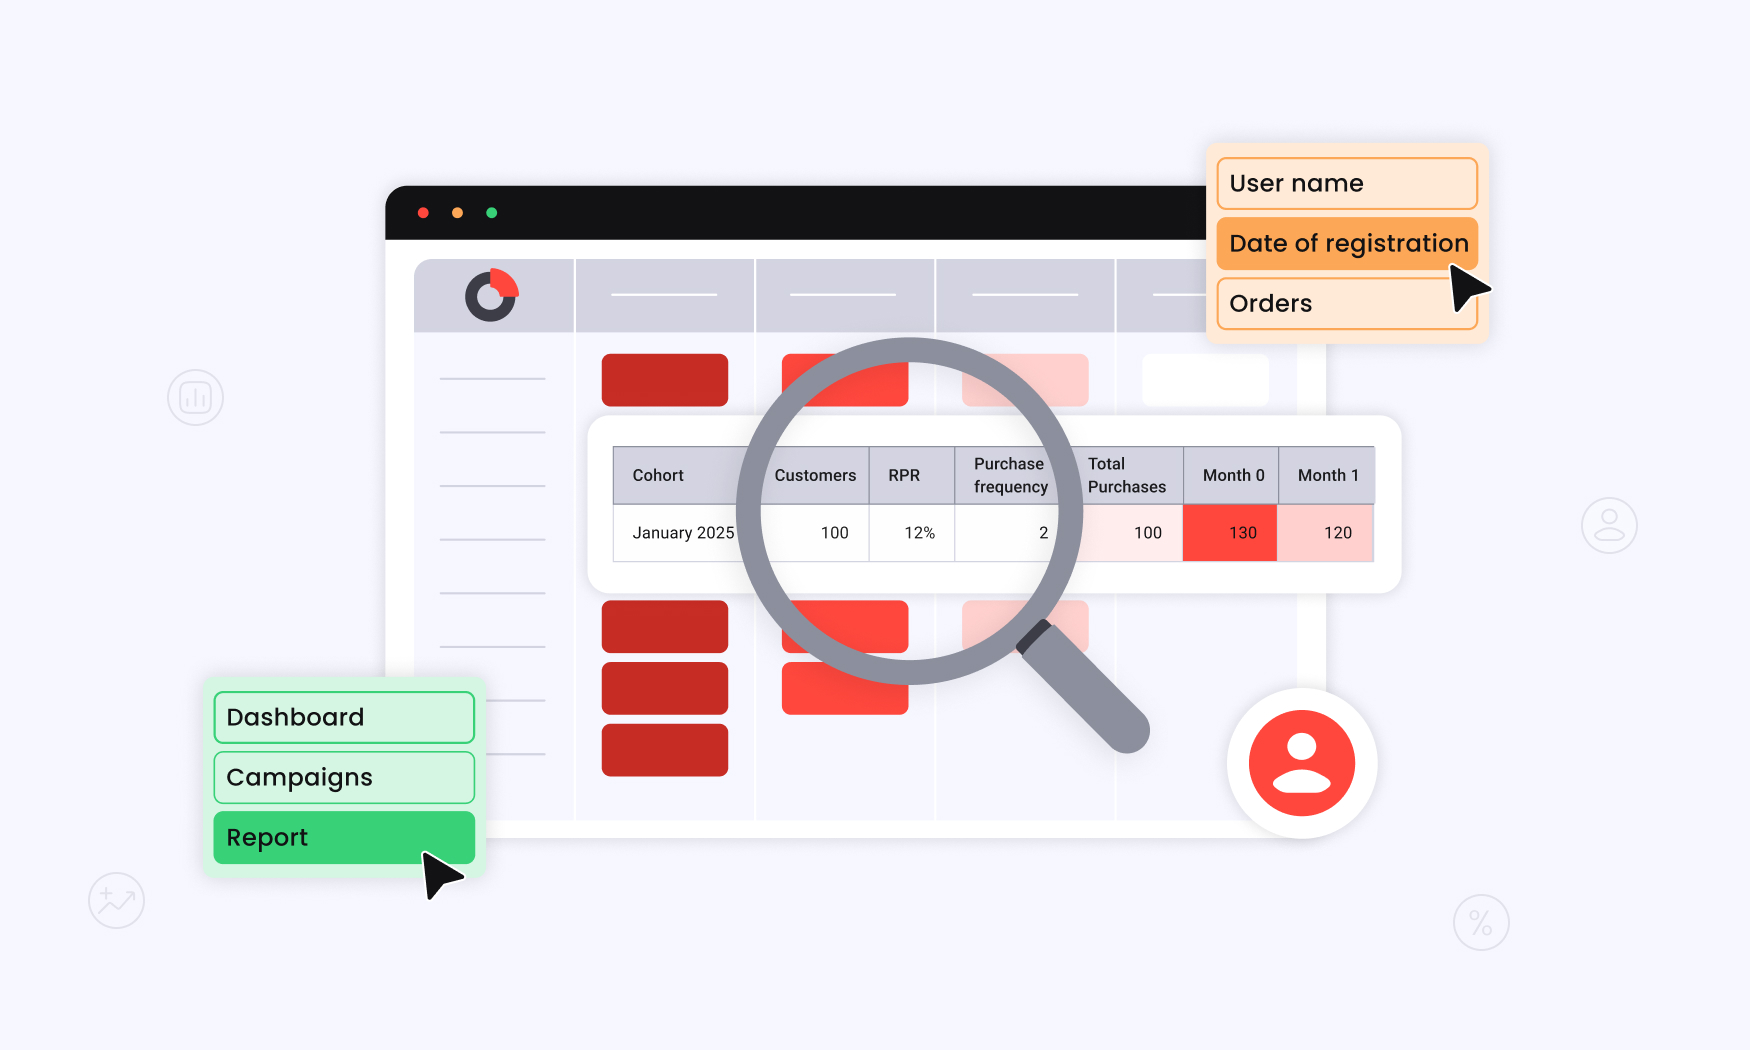
Before you even touch a cohort analysis chart, get clear on what you actually want to find out. RedTrack can show you user retention, revenue, repeat purchases—you name it. But if you don’t have a real question in mind, you’ll just end up lost in a sea of numbers.
A solid goal is always tied to a real business problem, like a sudden drop in user retention after a campaign tweak, or customers ghosting you after their first buy. Once you know what you’re chasing, picking the right metrics becomes easy.
Start with any of these goals:
- understand why customer retention dipped after a campaign or product change;
- identify which acquisition sources bring long-term customers;
- spot where users skip the onboarding process;
- measure whether a recent change actually improved behavior.
Every goal zeroes in on a group of users with shared characteristics, such as the sign-up date, where they came from, or which campaign brought them in.
2. Enable Cohort Analysis
Before you run any cohort report, make sure you’ve got two things locked in.
First, you need to track Purchases the right way. Only conversions marked as Purchases count for cohort analysis. If you’re logging them as generic events or leads, they’ll never show up in your cohort table.
Second, turn on the Customer Journey feature for your chosen conversion type. That’s what lets RedTrack monitor customer behavior over time and tie their repeat actions back to the right cohort.
Miss either of these steps, and your cohort analysis will be off, or worse, totally misleading. Double-check before you dive into the reports.
3. Select the Brand and Define the Cohort Period
Cohort analysis in RedTrack always starts with picking the right Brand. Every number you see comes from that brand’s customer data, so if you’re juggling multiple brands, don’t skip this step.
Next, set your cohort period, which means the window during which customers made their first purchase and got grouped together. Most teams start with time-based cohorts, grouping users by acquisition date or sign-up date, so performance can be compared consistently over time.
You can fine-tune how cohorts are grouped and compared by using:
- Breakdown — control how different cohorts are split visually (for example, by time periods);
- Segment — isolate specific customer groups, such as those from certain traffic sources, campaigns, or attributes.
This is where your intent really matters. If you want to compare campaigns, focus on acquisition data. If you’re after retention or repeat purchases, keep your cohorts broad and let the patterns reveal themselves naturally.
4. Track the Right Metrics
Your dashboard gives you a bunch of cohort metrics, but tracking them all at once just clouds things up. Stick to the numbers that actually tell you what your customers are doing.
Check out these key metrics:
- Repeat purchase rate (RPR) — reveals whether customers return after their first purchase;
- Purchase frequency — shows how often they buy once they do return;
- Total purchases — highlights volume growth or decline over time;
- Total revenue — shows which customer cohorts drive revenue growth, so you can see what’s worth investing in;
- Average order value — reveals whether value comes from more orders or bigger orders.
These metrics make it easier to understand user retention, identify high-value customers, and pinpoint changes in the overall customer experience after the first purchase. Pick the metric that matches your goal. If you’re chasing retention, RPR and purchase frequency tell the clearest story. If it’s revenue growth you care about, total revenue and AOV are where you should look.
5. Compare Cohorts and Look for Patterns
When conducting customer cohort analysis, don’t just read numbers line by line. Compare them side by side. See how a specific group stacks up against another in the same timeframe. Maybe one cohort churns after a week, while another hangs on for three months. That’s where the real story is.
Those differences are rarely coincidental, so when you compare cohorts, find consistent gaps that explain why performance looks the way it does.
Pay close attention to:
- when repeat purchases slow down or stop;
- the customer cohorts that retain longer;
- whether newer cohorts outperform older ones;
- when new customers drop off during onboarding;
- how behavior shifts after key events (like a price update or a new feature).
If you see the same behavior repeating across multiple cohorts, that’s usually your signal. It might point to a strong acquisition source, a weak onboarding step, or a value gap that only shows up after the first purchase. RedTrack ties all of those to the same customer data, so patterns are backed by real user behavior.
Common Mistakes to Avoid When Conducting a Customer Cohort Analysis
Cohort analysis works best when it stays focused and consistent. Small missteps can blur insights and lead to the wrong decisions.
- Relying on averages — Averages hide radically different behaviors behind one number. You can have very successful cohorts that mask weak ones, making the overall business look healthier than it really is. The magic of a cohort view is looking at how distinct customer segments evolve.
- Tracking too many metrics — When you are tracking everything, it is impossible to know what really matters. By focusing on a few meaningful and goal-oriented metrics, you can easily understand what is happening and take necessary actions on them.
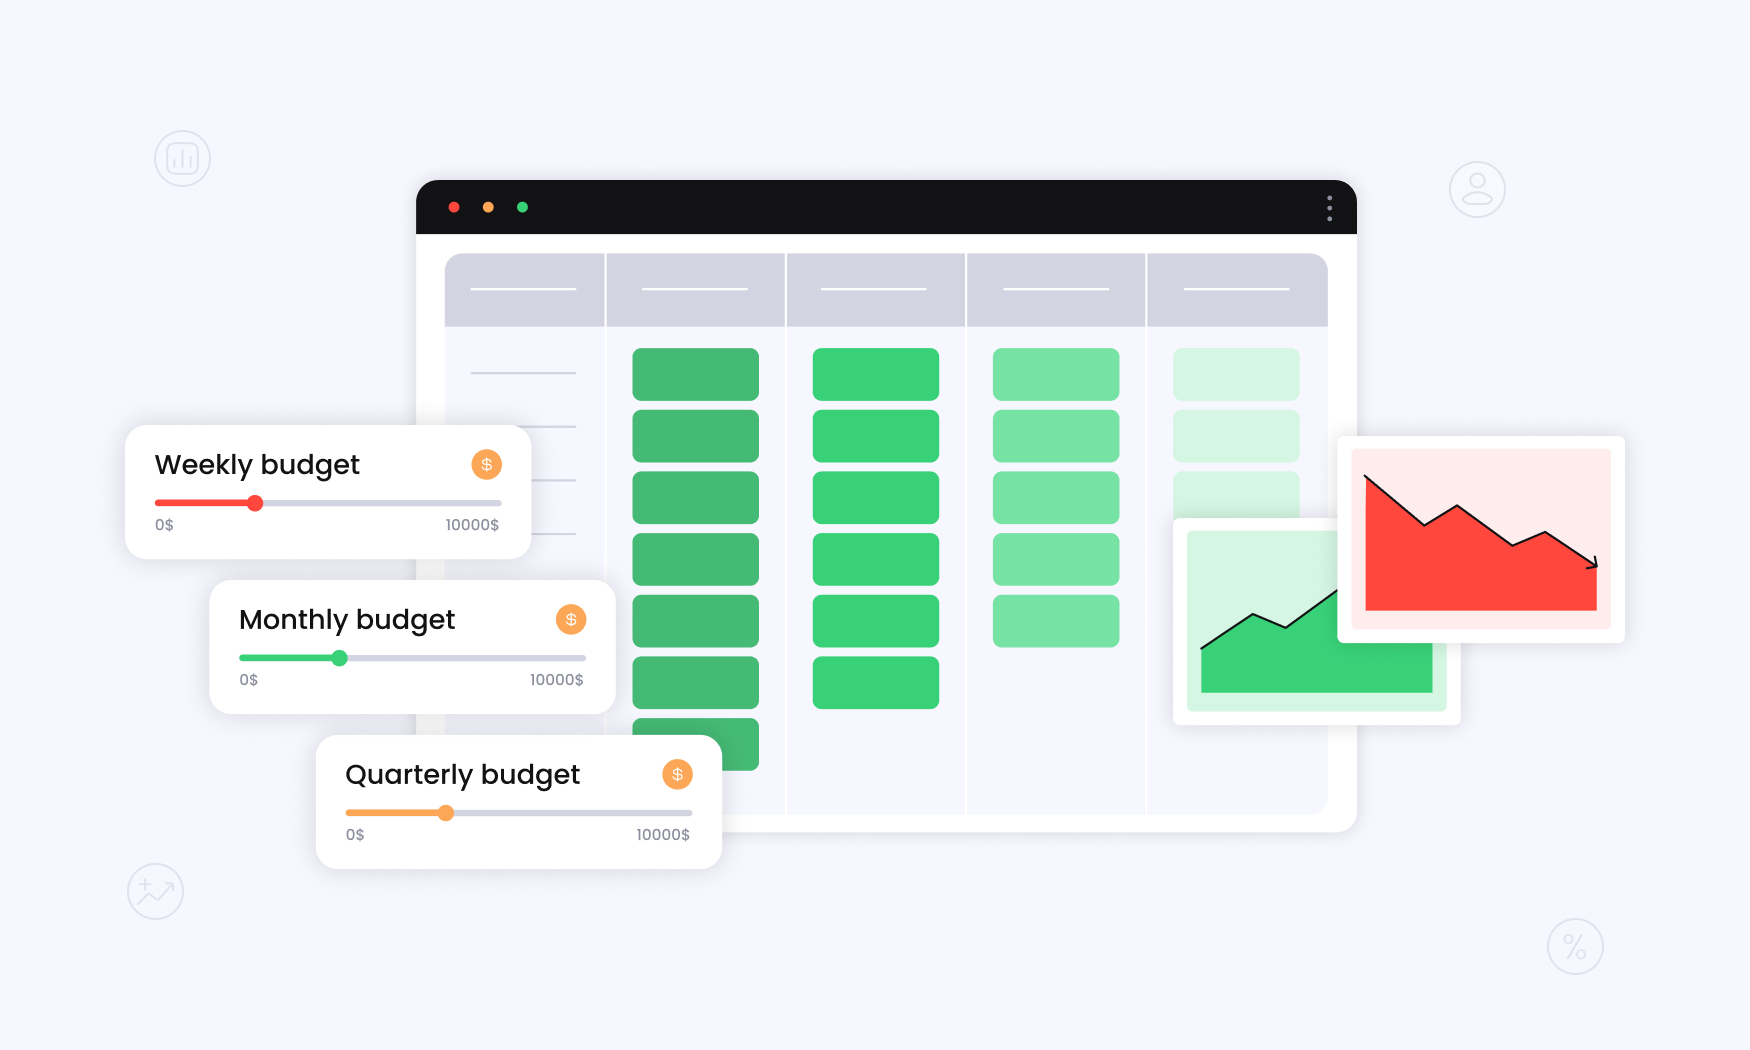
- Changing time windows mid-analysis — Switching time periods halfway through breaks comparisons. Weekly, monthly, and quarterly cohorts tell very different stories. Keeping the time window consistent makes trends reliable instead of coincidental.
- Drawing conclusions from one cohort only — A single cohort can be representative of seasonality, a one-time campaign, or that sales spike you had. You don’t know if it is replicable. Insights are only insights when you see the same pattern across multiple cohorts and time.
Using RedTrack for Customer Cohort Analysis
Cohort analysis often breaks down once data starts living in too many places. For instance, acquisition data sits in ad platforms, costs update on different schedules, and product and post-conversion behavior live somewhere else entirely. By the time you try to pull it all together, you’re already working with gaps, assumptions, and delayed insights.
Clean, unified customer data is what makes cohort analysis reliable. According to House of Martech, teams using unified customer profiles or customer data platforms (CDPs) see 2–3x improvement in customer lifetime value. RedTrack fits naturally into the process.
RedTrack includes built-in cohort analysis reporting, so tracking how different groups behave over time doesn’t require manual stitching or exports. Everything updates in one place, using the same source of truth.
What really strengthens this setup is RedTrack’s built-in CDPs. Every user action is tied back to a single profile, from first click through conversion, engagement, and revenue. That makes cohorts far more accurate because they’re based on complete user journeys.
RedTrack supports cohort analysis with features like:
- Cohort analysis reporting — track customer retention, user engagement, and value trends across defined customer groups;
- Built-in CDP — unify acquisition, behavior, cost, and revenue at the user level;
- Cost synchronization — keep ad spend accurate across cohorts and time periods;
- Cross-channel tracking — follow users across platforms without losing context;
- Attribution visibility — understand how different touchpoints contribute to customer value;
For performance marketers, this means seeing which campaigns actually bring long-term users. Plus, you’ll get clearer insight into traffic quality beyond the first conversion. With unified data and cohort reporting in one system, cohort analysis becomes something you can trust and act on.
Conclusion – Turn Customer Cohort Analysis Into Action With RedTrack
When customer cohort analysis is done properly, it changes how you make marketing decisions. You stop reacting to vanity metrics and start understanding what’s really driving customer behavior.
That difference really shows up when you’re deciding where the budget should go, which advertising campaigns deserve to be scaled, and which users are actually worth fighting to keep.
At that point, accuracy matters more than dashboards. You need to trust that what you’re seeing reflects real behavior, not stitched-together data. RedTrack is the only advertising management software that truly makes an impact here.
RedTrack doesn’t just show you specific cohorts in isolation. It combines ad tracking, marketing attribution, cost data, and cohort analysis reporting in one system, so every insight is grounded in a single source of truth. Because RedTrack also has a built-in customer data platform, every action is tied back to a single user profile, from first click to user engagement and revenue.
This setup puts the focus back on decisions that drive customer retention and long-term value. Instead of guessing which campaigns bring long-term users or why retention shifted, you get access to real data that guides your decisions.
If you want to experience what cohort analysis looks like when the data actually lines up, try RedTrack free for 14 days and begin your journey to low churn rates!


