Optimizing for conversions – that’s pretty much what you’re doing if you’re running paid campaigns for an e-commerce. You report on CPA and look for ways to help ROAS climb.
Here’s something you probably already knew: not all conversions are worth the same.
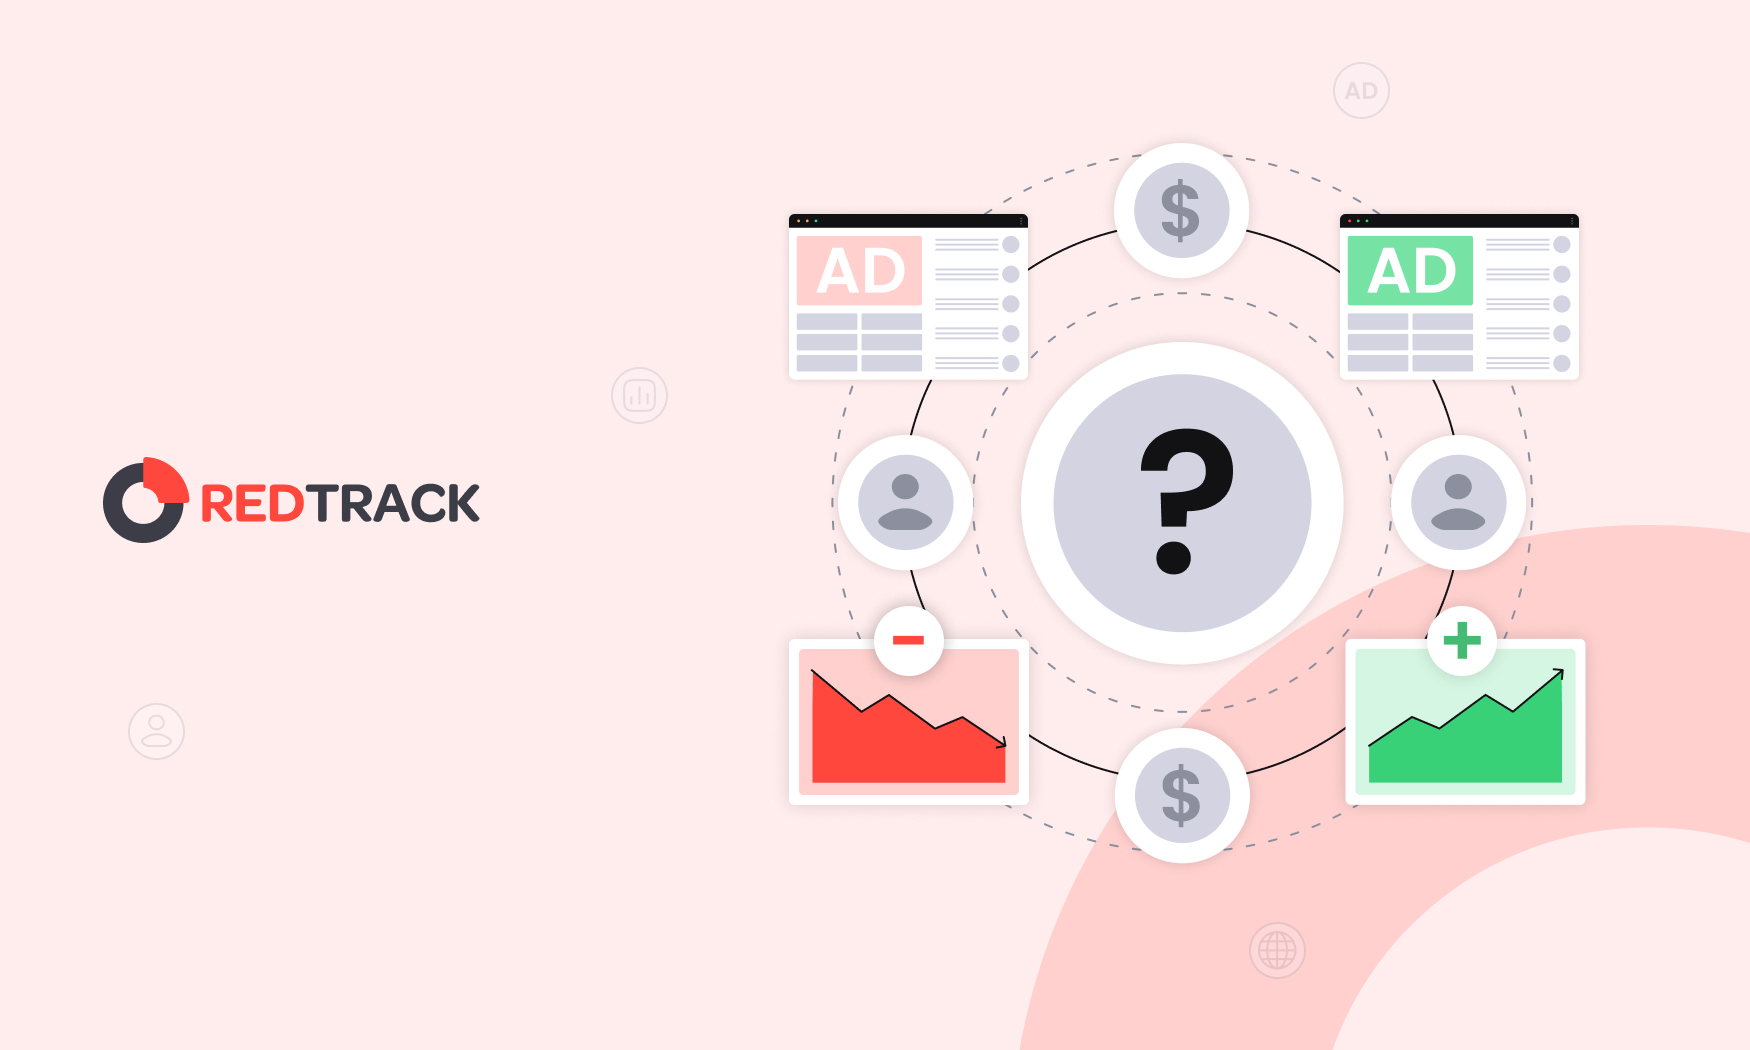
Ad platforms can’t tell the difference between repeat purchasers and one-time buyers. All they see are conversions. You can already imagine why this is a problem.
This is where cohort analysis changes the game, and in this use case we’ll walk you through how to use RedTrack’s Cohort Analysis report to see LTV broken down by channel and campaign.
Challenge: Flying Blind on Which Customers Actually Drive Revenue
When you’re running paid ads for an e-commerce brand, conversions are king. Every media buyer knows this. You optimize for them, you report on them, and your whole strategy revolves around getting more of them at a lower cost.
But here’s what most people don’t stop to think about: a conversion doesn’t tell you how valuable that customer actually is.
Think about it. One customer buys a pair of sneakers, never comes back, and that’s it. Another customer buys the same sneakers, then comes back two weeks later for a jacket, and then again the following month for accessories. Both show up as a single conversion in your ad platform. But the revenue they generate over time? Completely different.
And this is where things start falling apart for media buyers.
Google, Meta, TikTok – they’ll happily show you clicks, conversions, CPA, maybe even ROAS. What they won’t show you is what happens after that first purchase. Did the customer come back? Did they buy again? Are they still active three months later? Your ad platforms have absolutely no idea.
So you end up making decisions based on first-purchase data alone. You see a campaign driving conversions at a great CPA and you throw more budget at it. Makes sense, right? But what if 80% of those customers never return? Suddenly that “winning” campaign doesn’t look so winning anymore.
Now, some marketers try to figure this out on their own. They pull revenue data from Shopify, export acquisition data from their ad channels, try to match everything up in a spreadsheet, segment users into cohorts, and attempt to track purchasing behavior over time. It’s painful. And by the time you’ve built out that report, the data you started with is already stale.
Without lifetime value analysis plugged directly into your media buying workflow, you’re left dealing with some pretty costly blind spots:
- Campaigns that bring in cheap but low-quality, one-time buyers keep getting scaled
- The campaigns quietly acquiring your most loyal, highest-LTV customers get overlooked
- Budget allocation decisions are built on incomplete, surface-level data
- You can’t show a client or your team which efforts are actually compounding revenue over the long run
In e-commerce media buying, the first conversion is just the beginning of the story. If you can’t see LTV broken down by channel, campaign, and cohort, you’re optimizing for a number that only tells you half the truth.
Here’s the rewrite:
Here’s the rewrite, tight to the transcript:
Solution: Use RedTrack’s Cohort Analysis to Analyze LTV by Channel and Campaign
RedTrack doesn’t just capture first-party data like clicks and conversions in real time. It also fetches revenue and cost information and stores everything in one place. But what makes it especially powerful for e-commerce media buyers is what it does with all that data: it builds lifetime value reporting that gives you the granularity to understand which cohorts of customers drive the highest LTV, where those customers originate from, and how to adjust your media buying efforts to acquire more of the ones that actually matter.
Here’s how to run a cohort-based LTV analysis inside RedTrack.
Step 1: Navigate to Cohort Analysis under Customer Analytics
From your RedTrack dashboard, go to the Customer Analytics module in the side menu. Inside, you’ll find a report called Cohort Analysis. This is where all your LTV insights live.
The way it works is that on top of the first-party data RedTrack tracks and captures independently (clicks, conversions), it layers in the revenue and profit information from your e-commerce platform – Shopify, WooCommerce, whatever you’re on. RedTrack is platform-agnostic, so it supports basically all e-commerce platforms. The cohort report is then built using the data from your shop.
Step 2: Configure your report
The report is structured as a table. You start by choosing the time period for your cohorts – day, week, or month. That’s completely up to you and depends on how you want to slice the data.
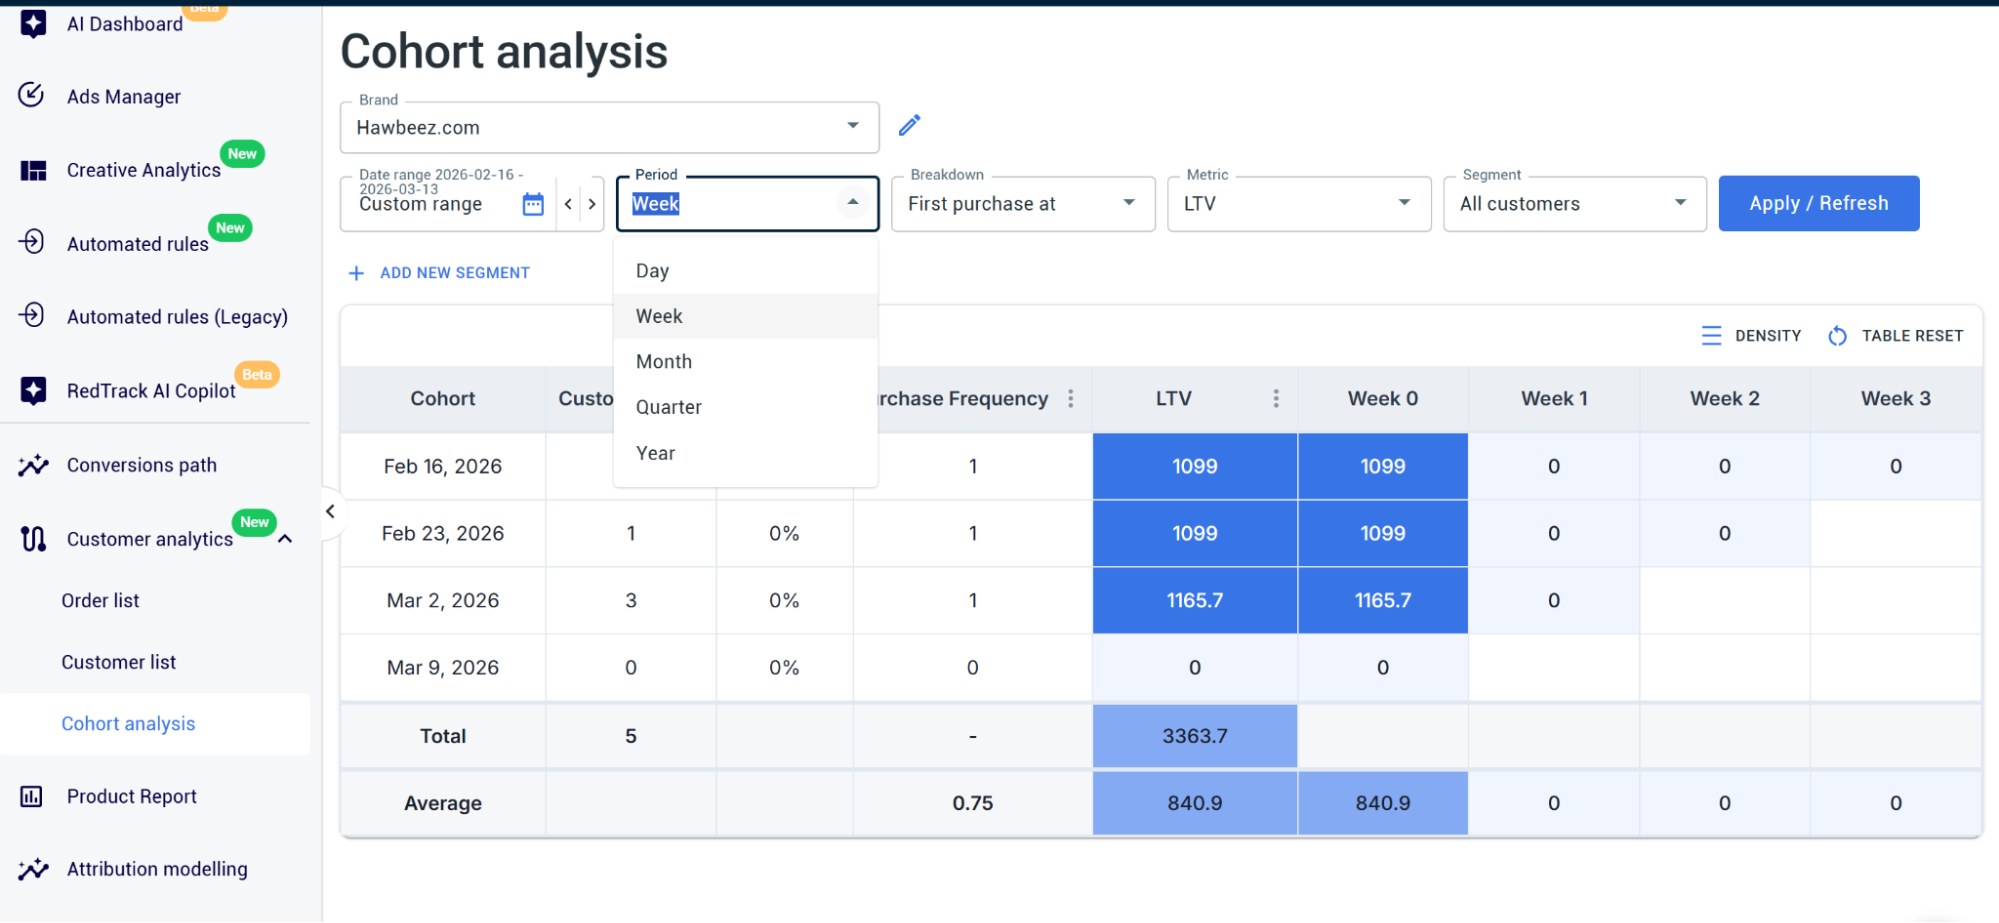
Then you select the timeframe you want to analyze and choose the metric you want to track. LTV is the obvious one, but you’re not limited to it. You can also analyze AOV, total revenue, total purchases – you name it. Everything gets framed as cohort reporting.
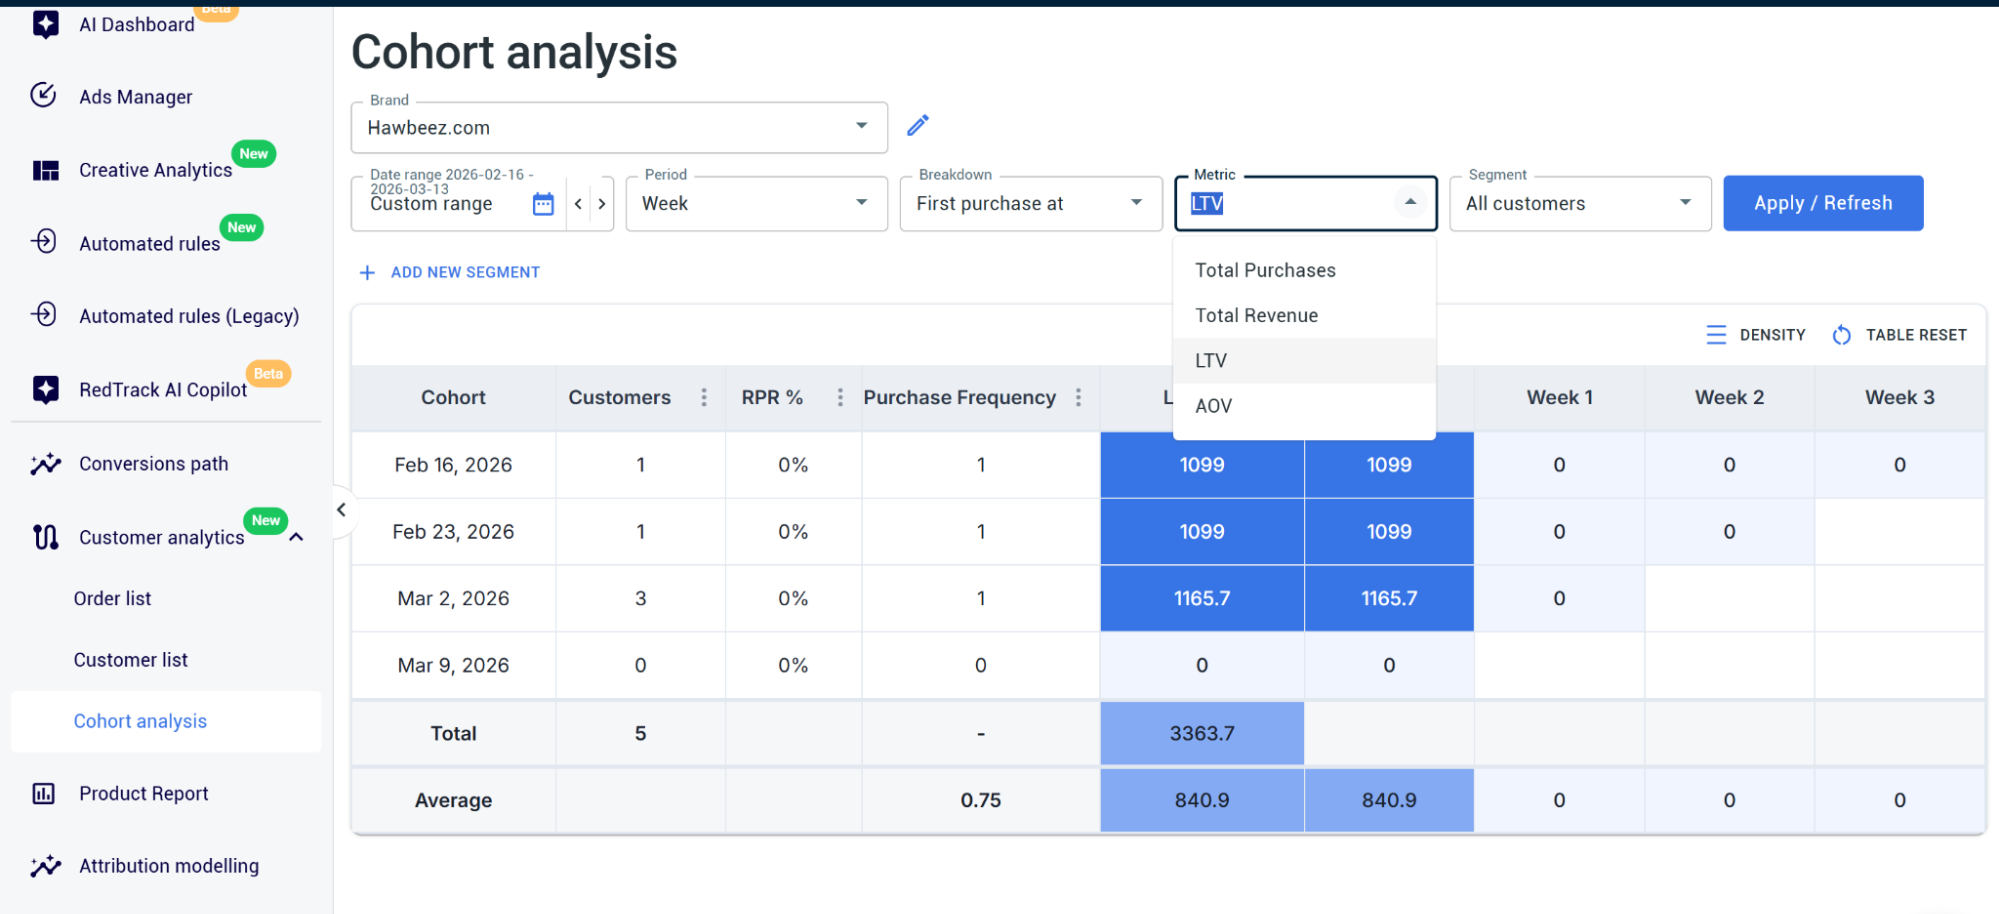
What makes this so valuable is what you see for each cohort: the number of customers, purchase frequency (how often one customer bought something from you), lifetime value, and the dynamics by month.
So you can actually watch whether a specific cohort is driving recurring revenue, repeat purchases, and growing lifetime value over time – or if they’re dropping off.
Step 4: Apply segments of choice to refine the data
This is exactly where you can get really granular and get exact numbers you are after. You can apply different segments to filter the report and see the data in a more specific way.
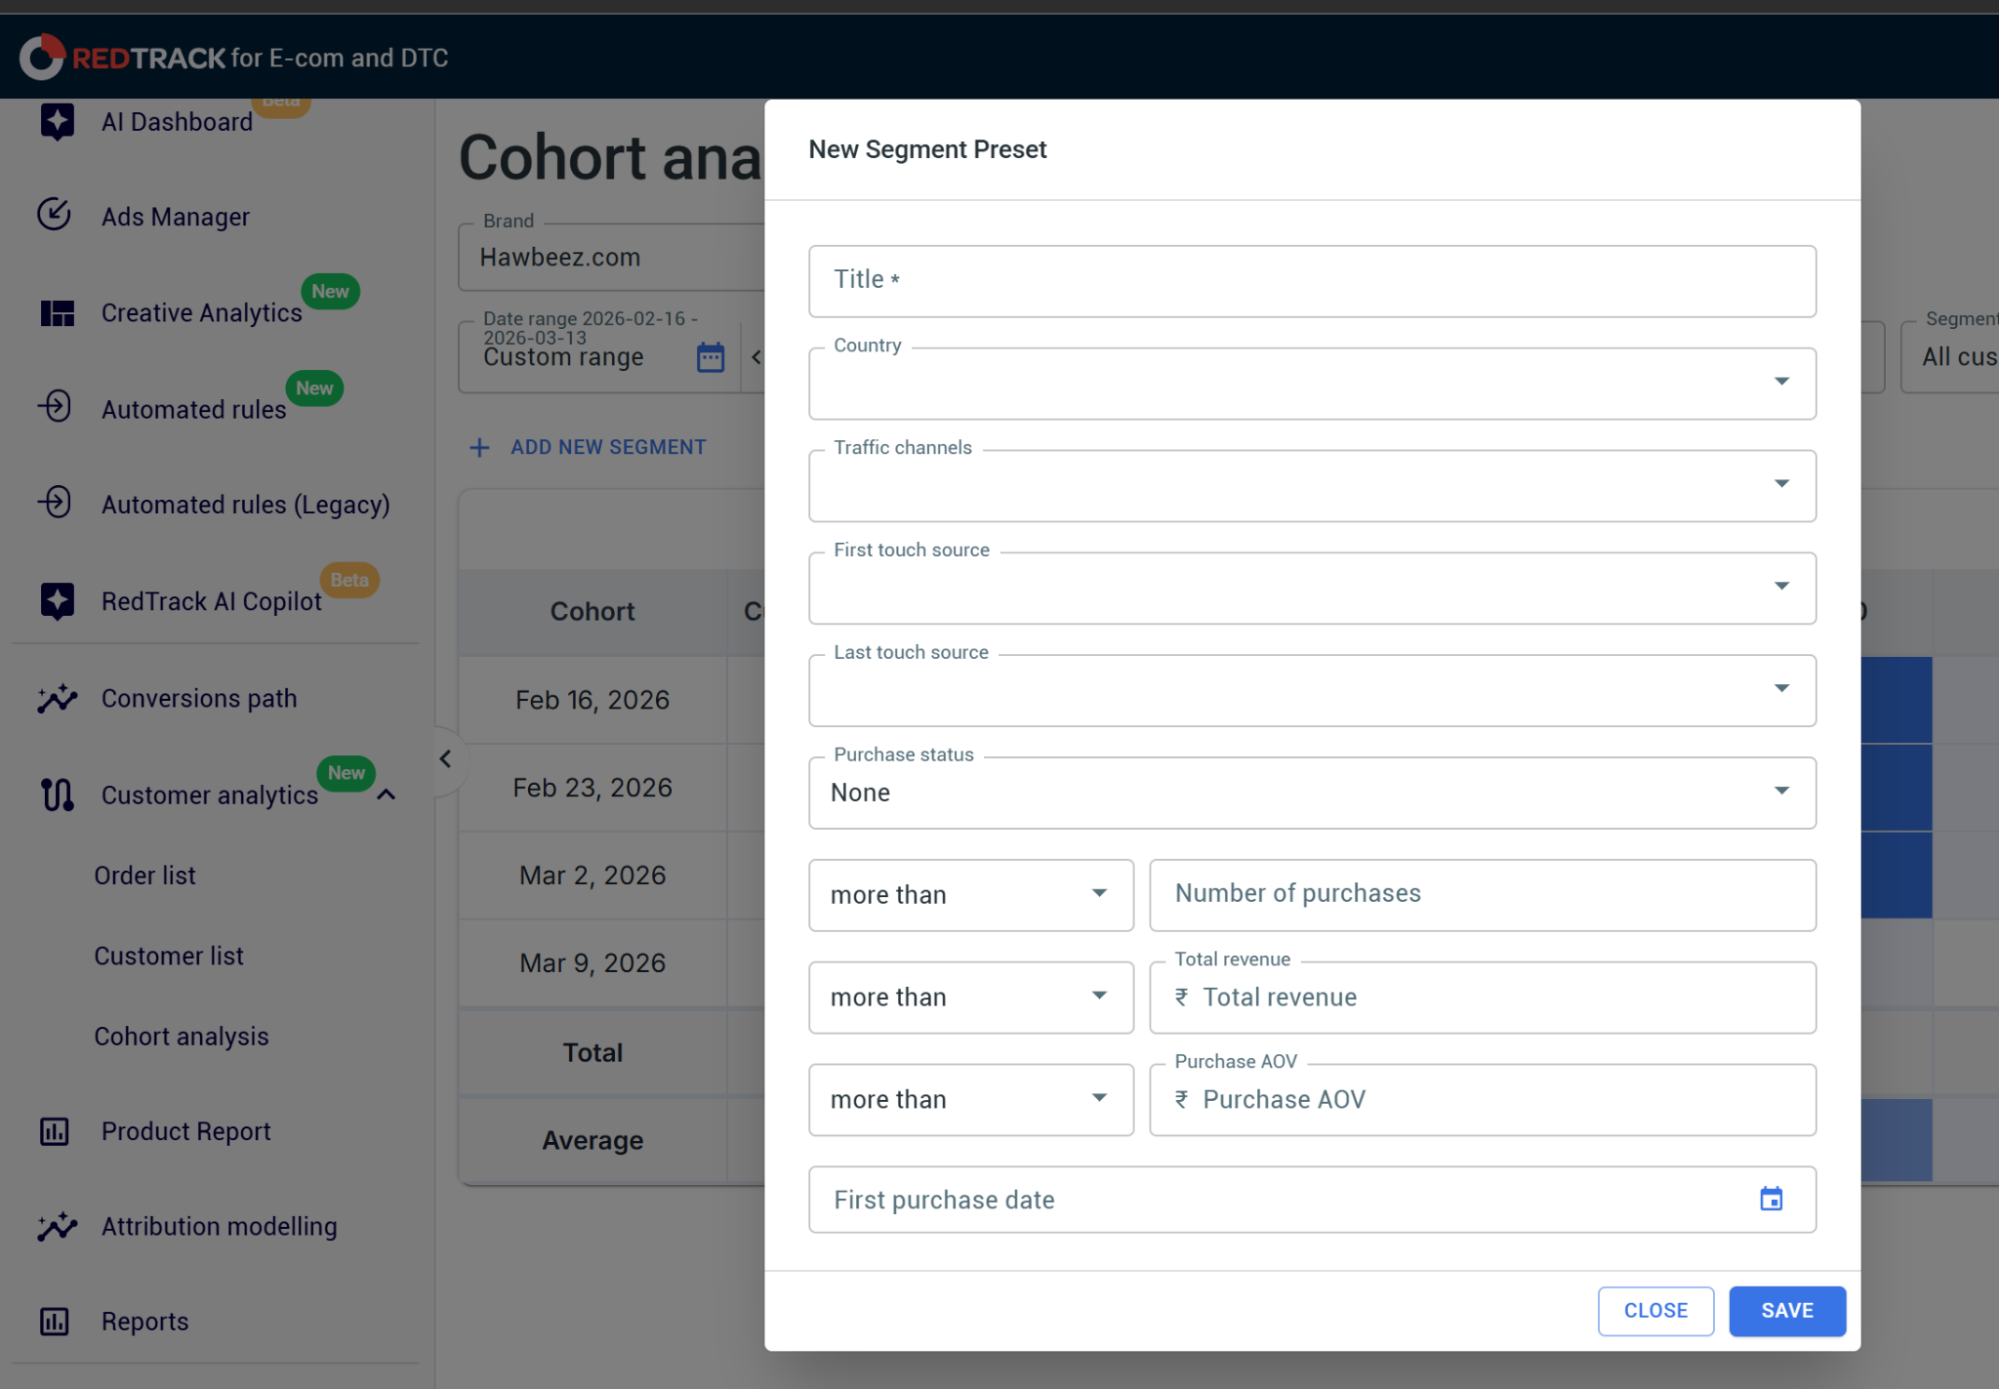
Say you want to analyze how your Meta campaign cohorts behave, or what LTV they’re driving for purchases and customers. You apply the segment, choose the traffic channel that generated the users in that cohort, and you can add conditions like number of purchases, revenue, AOV, and first purchase date.
So you can make the reports as specific as you need to sort out which fractions of your acquired users actually perform the best.
Step 5: Optimize your campaigns based on what the data shows
And we came to the part where it all pays off. Let’s say you dig into the data and notice that TikTok users from a campaign in October 2025 – a specific one targeting women, 30+, working in offices – have driven the maximum LTV out of any cohort. That’s your signal.
Now you can scale that campaign, invest more into it, create similar ones, build localizations, or expand it globally. You’re not guessing anymore. You’re making decisions based on which customers actually drive recurring revenue – and which campaigns brought them in.