Global campaigns rarely perform equally across locations. While some GEOs produce a profit, others drag the entire campaign down.
To find out which locations deliver what, most advertisers rely on native ad platform reporting to get a sense of how well different regions are performing. But just like attribution reporting, those platforms only give you a partial view of what’s really going on.
So teams who want to optimize their campaigns in time and stop losing budget in the wrong places, turn to more efficient and effective tools that provide the real-time, accurate reports they need to run successful ad campaigns.
Challenge: Working Out Which GEOs Actually Drive Your Profits
When you run ad campaigns across multiple countries and cities, relying on ad platforms to accurately tell you where your highest returns are coming from is close to impossible to do if you want to do it efficiently and effectively.
Why? Because ad platforms like Google Ads or Meta Ads tend to either miss or skew some of your conversions and clicks.
This happens in two ways:
- Lack of server-side tracking – Since traditional ad platforms don’t use server-side tracking, which bypasses browser-based ad blockers, a significant portion of clicks and conversions is completely left out of their reporting.
- Platform bias – Ad platforms tend to favor their own data and attribution models. Some ad platforms may claim 100% of the conversion, even though the same user may have clicked on multiple other ads on other platforms as well.
Why can’t You Depend on the GEO Insights from Ad Platforms?
First of all, while these platforms claim to provide ‘granular’ geographic insights on your ad campaigns, they only offer them on the clicks and conversions they’ve been able to collect (legally).
This means you won’t get the clicks from users with ad blockers, or those who opted out of tracking (for example, via Apple’s App Tracking Transparency).
Second, because you don’t control which attribution model your conversions follow (the ad platform does), you are left to work with the biased data each platform provides.
Not to mention all the duplicates you’ll find when the time comes to clean your data so you can put together a set of accurate insights for current and future campaign optimization.
What you are now faced with as a performance marketer or media buyer is a serious visibility and accuracy issue. One that a tool like RedTrack can solve easily and efficiently, but we’ll get back to that in the solution.
Another Reason Why Ad Platforms Don’t Give You Deep GEO Insights
Now we’re not trying to badmouth ad platforms here; we’re simply giving you a reality check.
Ad platforms were never designed for cross-channel profitability analysis (which is what you’re trying to do when you’re doing GEO ad campaign targeting).
They were designed for campaign delivery, and that’s what they do really well.
Profitability analysis is not their forte or core focus. But, if you do use them for GEO reporting, know that you might come face-to-face with two key limitations across these platforms, including:
- Your conversion data won’t be tied cleanly to revenue
- Delays in reporting, which will slow down optimization decisions
But alongside these two limitations, you’ll also come to an even bigger issue (one that’s of a practical nature), and that is aggregating the GEO data.
Remember, your GEO data sits across multiple platforms. To do proper GEO analysis, you’ll need to export individual reports, combine spreadsheets, and manually compare and clean the data, just to work out which locations are winners and losers.
Now, imagine all the time you need for this entire process. If you’re running ad campaigns that need to be optimized fast, it will be an impossible feat. By the time you gather an insight or two, your budget has already been wasted in the wrong places, targeting the wrong customers.
But let’s get back to the problem you’re here to solve: working out which GEOs actually drive your profits.
Why GEO Visibility Matters
Not only do you want accurate conversion and attribution data, but you also want to be able to filter down to the country and city where you ran your campaigns, so you can see which locations:
- Perform well (hit your targets)
- Outperform your expectations (go way beyond your targets)
- Underperform (deliver below your target expectations)
The reason you want this kind of truly granular data is this: when you have it, you can make ad campaign optimization decisions that work in your profit’s favor and increase ROAS.
Let’s take an example.
You might be running a campaign that’s targeting multiple countries and cities. But while the campaign may appear to be profitable as a whole, unless you can drill down into that data to individual countries and cities, you won’t be able to see:
- Which country or city delivered the most conversions
- Which broke even
- Which locations consistently resulted in a complete loss when it comes to ad spend
So, without detailed GEO analysis, media buyers, marketers, advertisers, and e-commerce brands generally continue to fund underperforming locations, instead of redirecting that budget to high-performing ones.
And that’s how geographic performance directly impacts your profitability.
But when you have access to accurate conversions and proper GEO insights for your ad campaigns, you can:
- Scale your ad spend to profitable locations
- Reduce spending in weak markets
- Localize creatives, landing pages, and offers
- Improve blended ROAS
- Expand globally, while keeping risks at a low
Now, let’s take a look at how RedTrack solves this problem for ad campaign champions who want to get the most out of their ad spend.
Solution: Use RedTrack for Real-Time GEO-Data Driven Performance Optimization
RedTrack is a bit of a dream tool for performance marketers and media buyers because it connects clicks, conversions, costs, and revenue data across multiple channels and centralizes it into a single reporting dashboard.
So instead of relying on individual ad platforms and fragmented data, RedTrack let syou analyze performance in real-time, based on real outcomes.
With RedTrack, you can:
- Break down campaign results by country and city
- Attribute conversions and revenue to specific GEOs
- Compare profitability across locations instantly
- Spot hidden winning markets in real-time
- Identify loss-making locations
And because RedTrack collects revenue data and conversion, you can do proper GEO optimization in real-time, so you can focus on instantaneous campaign optimization and see true financial performance.
How to do In-Depth GEO Targeting Analysis with RedTrack
Before you can do in-depth GEO targeting analysis, you’ll need to have your campaign set up for each of the traffic channels where you’re running your ads.
Step 1: Build Your Report
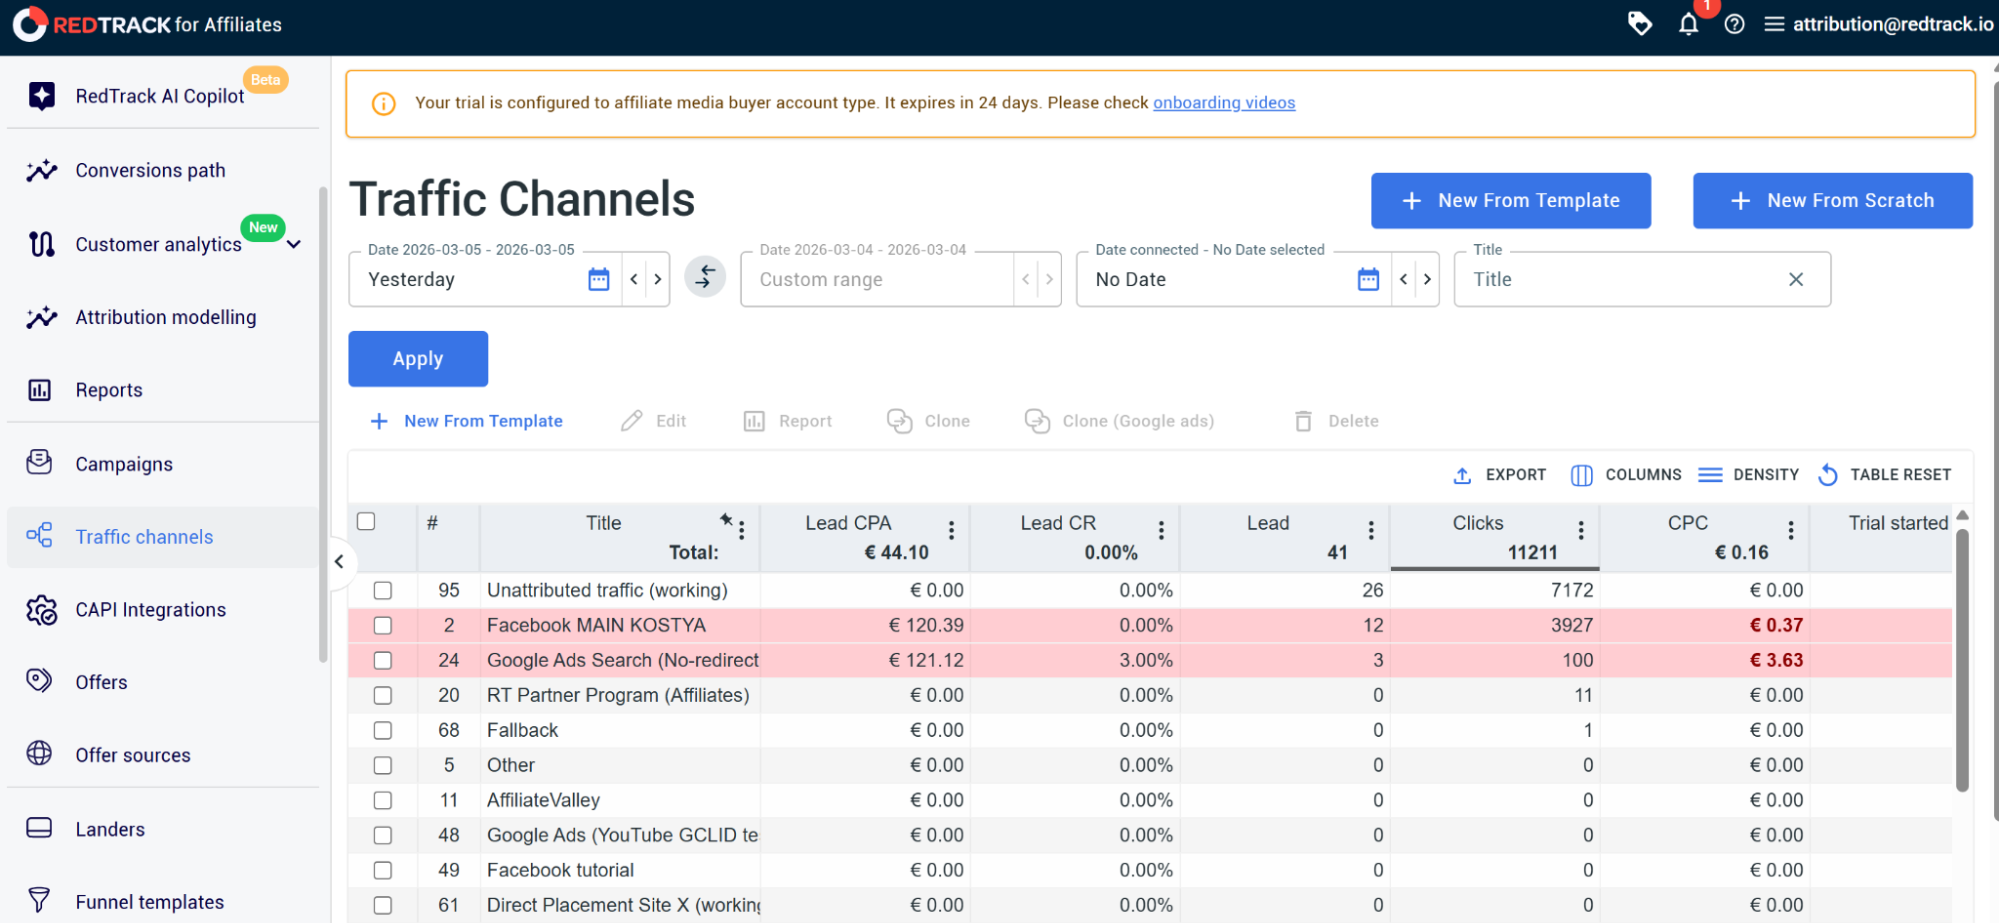
From the RedTrack dashboard navigation menu:
- Click on Traffic Channels
You will see a list of all your traffic channels. Hover over the Title of the channel you want to create a report for and click on the Report logo.
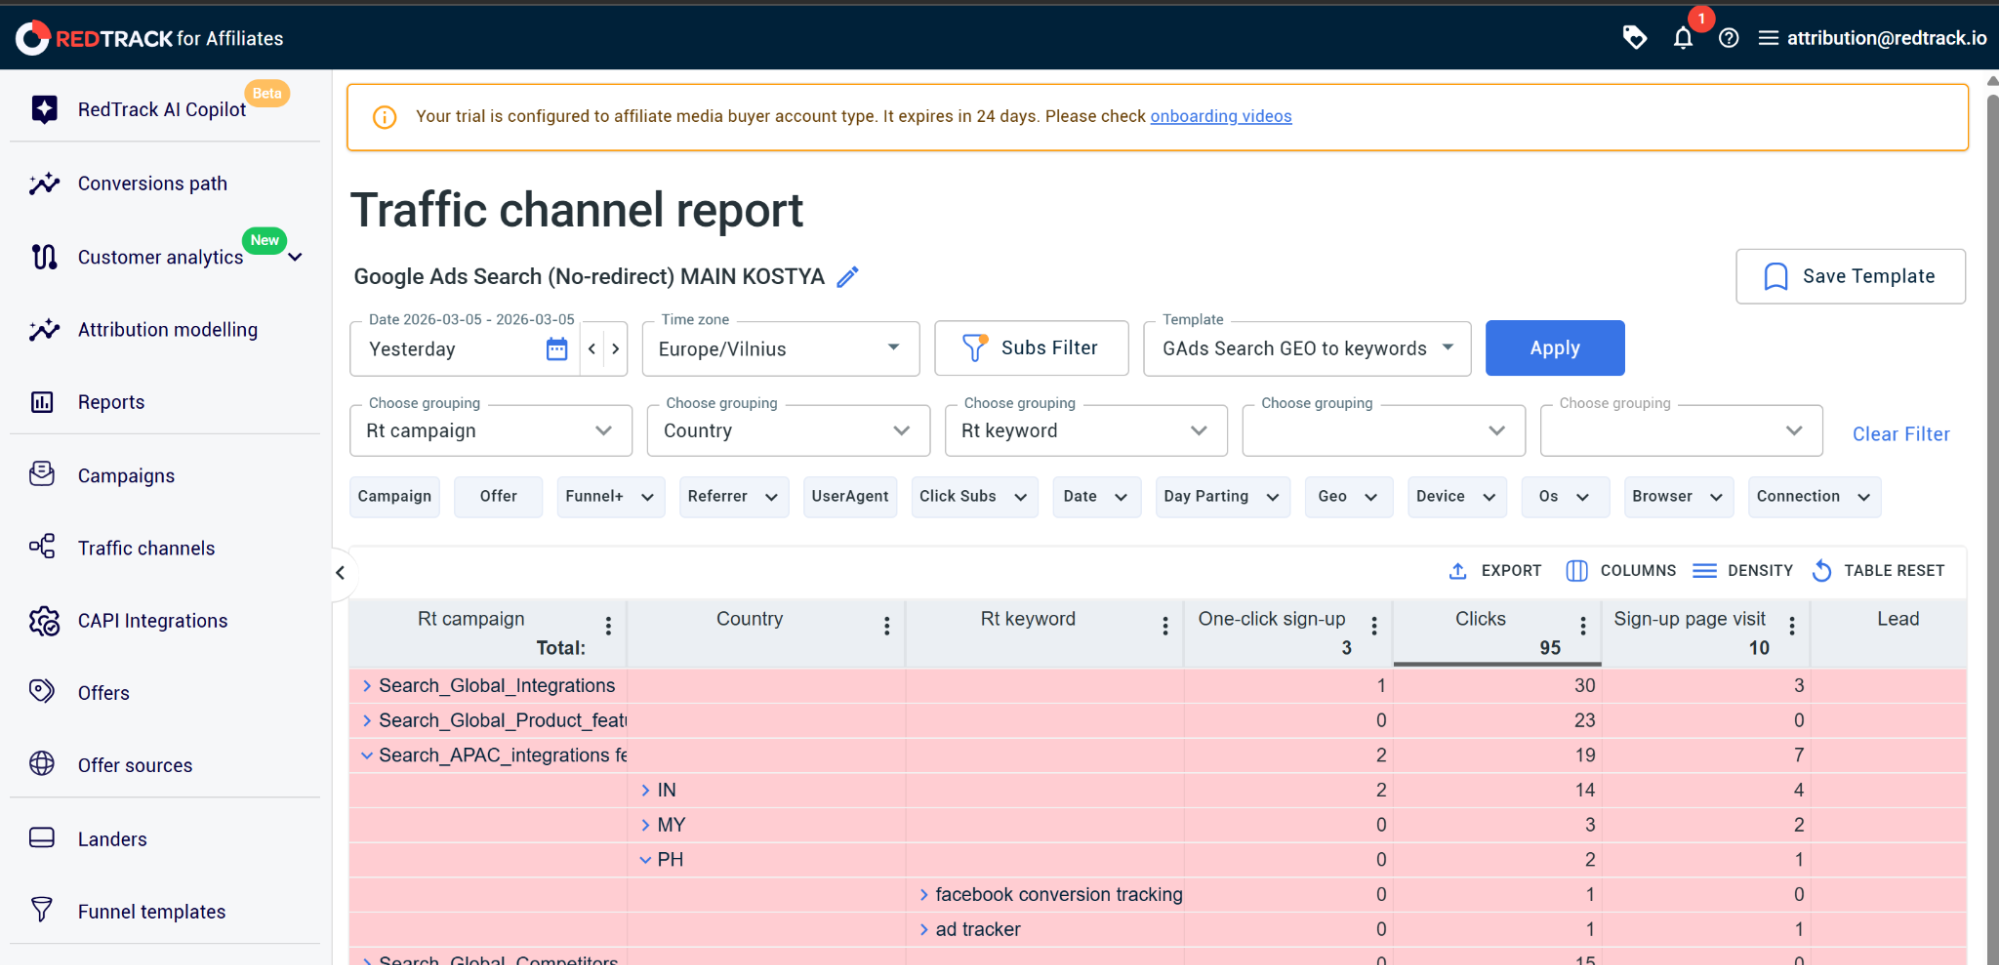
Step 2: Select your groupings (GEO Granularity)
A new screen will pop up, it should be titled Traffic channel report, and underneath it will be the title of your chosen traffic channel. You will have multiple drop-downs to select from, including everything from dates and time zones to templates and the report groupings we’ll focus on for this.
On this screen, you have 5 grouping levels you can use for the report. They are all nested into each other.
For a country and city grouping report:
- Go to the first Choose grouping drop-down and select Country
- Then move on to the second Choose grouping drop-down and select City
- Click Apply
You now have a report that reveals performance differences of the campaign across locations.
Step 3: Analyze Key Metrics Across GEO
Depending on what you want to include in your report, you can analyze your campaign’s performance across locations for:
- Conversion rates
- CPA
- Revenue
- ROI
- Profit
Step 4: Segment Winning & Losing GEOs
You can now use this data to segment and reallocate ad budgets from losing locations to the winning ones.
On top of that, you can also choose to:
- Reduce bids in weak locations
- Push for tailored creatives for winning locations
RedTrack: Turn GEO Targeting into a Profit-Driving Strategy
Using ad platforms to get GEO insights that will result in better targeting and more effective ad spend is a process filled with gaps, time lags, and inefficiencies.
RedTrack, on the other hand, is a tool that instantly gives you complete and real-time insight into exactly how your ads perform at every location.
So instead of scaling a successful campaign across all your locations, with RedTrack, you’ll know exactly which locations deserve to be scaled because they are already providing good returns.
Ultimately, the end result is smarter budget allocation, faster optimisation cycles, and a safer way to expand your business globally.
If you want to grow your campaigns internationally without guessing which markets to target, you need a tracking platform that shows you not just where traffic is coming from, but more importantly, which locations are actually making you a profit.
To see how RedTrack can boost your ad buying efforts, book a demo with RedTrack so the team can show you how to do GEO-level analysis in a way that transforms your campaign performance. And if you’re ready to try us out, sign up for your 14-day free trial now!