There are loads of businesses out there losing serious money on ads that don’t deliver. They track clicks, impressions, and conversions, without monitoring the one number that actually matters: breakeven Return on Ad Spend (ROAS). This is the one number that reveals if your ads are making money or quietly wasting it.
The true value in tracking ROAS starts with knowing what your breakeven point is, and when you know that, everything changes. From that point onwards, you can stop guessing, stop wasting budget, and start putting your ad spend into scaling the campaigns that actually bring you a profit.
When you finish reading this guide, you’ll know how to calculate breakeven ROAS, how to use it in day-to-day optimization, and how to set up your paid ads system to eliminate spend on unprofitable campaigns. Whether you run Google Ads, Meta Ads, Amazon Ads, or YouTube Ads, or invest your ad budget into some other channel, is irrelevant. Breakeven ROAS is a must for every business with an advertising campaign strategy because it’s the figure that informs and leads your smart ad spending. The kind that isn’t just going to help you survive in the market, but also scale.
What is breakeven ROAS, and why it matters
Breakeven ROAS is the point that separates ad spend that’s making you money and the one that’s simply wasting it. To be specific, breakeven ROAS is the minimum return you need to get from your ad spend to cover every cost (this includes product, shipping, fees – all of it) before you actually make a profit. And that’s why it’s appropriately called the “breakeven” ROAS.
If you’re like most people, you know and track your ROAS. This is fine, but standard ROAS is nothing more than a vanity metric. It may tell you the revenue earned as a result of ad spend, but it ignores the most crucial part: your margins.
What are we talking about here? Listen up – it’s basic math.
Let’s say you calculate your standard ROAS, and you land on the figure 3:1. At first glance, this seems quite solid. But, if your margin is only 25%, the reality is – you’re losing money. With a 25% margin, your ROAS needs to be at least 4:1 just to break even.
So now all of a sudden, that ROAS of 3:1 doesn’t look so impressive – does it?
When you know your breakeven point, it doesn’t just save you from an optimistic illusion; it also saves you from scaling bad campaigns.
There are loads of brands pumping money into all sorts of ads, thinking “to make money, you have to spend money,” even though their margins tell a different story. Sticking to this false positive will only take you to one place: spending more and making even less.
The logic behind the breakeven ROAS is simple:
- Everything above your breakeven ROAS is making you a profit.
- Everything below your breakeven ROAS is losing you money.
So treat your breakeven ROAS as a guardrail. It’s the point that keeps your advertising spend from eating into your profit.
How to calculate breakeven ROAS: Formula and step-by step process
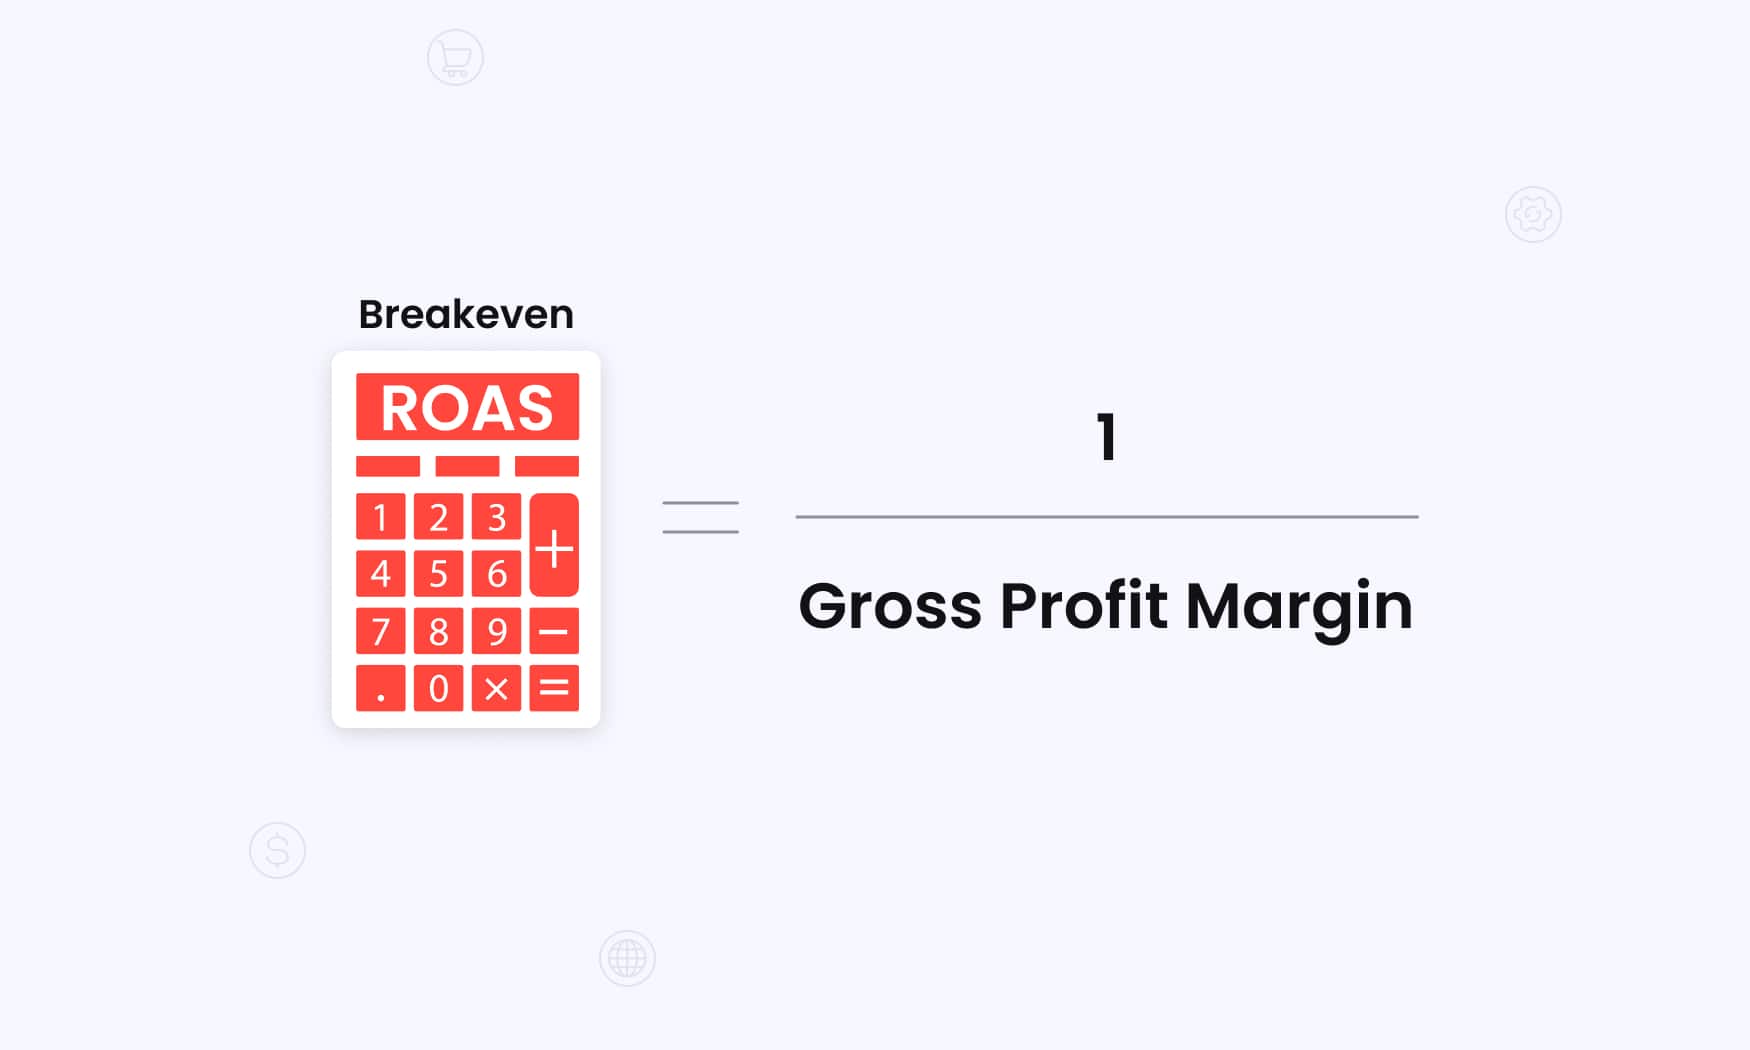
To calculate your breakeven ROAS, you need to use the simple formula:
Breakeven ROAS = 1 ÷ Gross Profit Margin
The number you get will tell you the minimum return you need just to cover your costs.
But to get there, you’ll first need to calculate your gross profit margin by using the formula:
Gross Profit Margin = (Revenue – Cost of Goods Sold) ÷ Revenue
Where “cost of goods sold” includes everything from the cost of production, shipping, processing, and packaging fees, as well as any refunds or any other variable cost tied to each sale.
You can also use the Average Order Value (AOV) if that’s easier:
Breakeven ROAS = AOV ÷ (AOV – Product Costs)
An example of a time when it makes sense to use this formula is when you know your per-order figures.
Here’s how you would go about it, step-by-step:
- Set your product price or find your AOV.
- Add up all the variable costs: product, shipping, processing, returns, etc.
- Subtract those costs from your selling price to get the gross profit.
- Divide gross profit by selling price to land your margin.
- Input that margin into 1 ÷ margin.
- Check it for reality. If the number doesn’t look right, go back and check you didn’t miss a cost.
Breakeven ROAS calculation examples
Let’s go through a few examples so you get the hang of what the process should look like.
E-commerce example:
Say you sell a product online for $80.
Costs:
- $30 actual product cost
- $8 shipping
- $2.40 processing fee (3%)
Total cost: $40.40
Gross profit: $39.60
Margin: 49.5%
Breakeven ROAS = 1 ÷ 0.495 = 2.02
So for every $1 you spend, you need $2.02 back just to break even. If you currently spend $1,000 on ads, you need to be making at least $2,020 in revenue to not lose money.
SaaS example:
Say you sell project management software with a monthly subscription price of $50.
Monthly Recurring Revenue (MRR): $50.
Variable costs (hosting, support, payment processing fees): $15
Margin: 70%
Breakeven ROAS = 1 ÷ 0.70 = 1.43
This part is simple enough, but SaaS is a little more complex because you’ve also got Lifetime Value (LTV), churn, and payback windows, which you’ll need to consider; otherwise, your calculations won’t reflect reality.
Dropshipping example:
Price: $60
Costs:
- $35 product
- $12 shipping
- $2 processing
Total: $49
Profit: $11
Margin: 18.3%
Breakeven ROAS = 1 ÷ 0.183 = 5.46
This is a really high breakeven ROAS, and thin margins are what make dropshipping a hard win. You basically need a ROAS higher than 5 not to be losing money.
Understanding ROAS vs ROI vs breakeven ROAS
ROAS, ROI, and breakeven ROAS look and sound similar, but each one answers a different question.
If you don’t understand exactly what each one tells you, you’ll probably end up making some bad decisions when it comes to advertising spend.
Let’s look at each one separately.
ROAS is the basic (but limited) advertising spend measure:
ROAS = Revenue ÷ Ad Spend
A 4:1 ROAS means you made $4 for every $1 spent. It sounds good, but it ignores the costs that hide behind the sales.
ROI is the overall profit figure (but it doesn’t focus on ads specifically):
ROI = Net Profit ÷ Cost of investment x 100%
The ROI factors in everything from overheads like salaries, rent, and tools, to marketing and advertising costs. In a nutshell, the ROI tells you if the business is profitable when you consider all your costs, not just your ad spend.
Breakeven ROAS is laser-focused on showing you where ad campaigns start making money:
It includes all variable costs linked to each sale, such as product, shipping, and fees, but it ignores the fixed overheads.
So in a nutshell:
- ROAS tells you: How much revenue did the ads generate?
- ROI tells you: Is the whole business profitable?
- Breakeven ROAS tells you: Is this campaign actually making a profit?
Here’s when and how you should use each metric to guide you in making smarter business decisions:
| Metric | Best Used For | Includes | Time Frame |
| ROAS | Campaign efficiency comparison | Ad revenue vs ad spend only | Daily/weekly optimization |
| Breakeven ROAS | Profitability threshold setting | Variable costs, not fixed overhead | Campaign planning |
| ROI | Overall business performance | All costs and expenses | Monthly/quarterly analysis |
Use regular ROAS to compare campaign performance and optimize ad groups.- Use breakeven ROAS to set minimum performance standards and avoid unprofitable ad spending.
- Use ROI analysis for broader strategic decisions when it comes to marketing channels and overall business direction.
Factors that impact your breakeven ROAS
There are a number of things that will impact your breakeven ROAS. So let’s take a look at each of the key factors.
Margins
The first and most important factor is your margin. Your breakeven ROAS is tied to and highly dependent on your margins.
- High margins lead to a better breakeven ROAS.
- Low margins make it harder to land a good breakeven ROAS.
If your margin is 50%, a 2:1 ROAS keeps you afloat.
Drop that margin to 20%, and all of a sudden, you’ll need a 5:1 ROAS just to stop losing money.
Shipping costs
Next, your shipping costs (which apply to all online sales of physical products) will also impact your breakeven ROAS.
Even if you choose to offer “free shipping,” that still needs to come out of your pocket. Returns are another given, which will also add up.
- The higher your shipping costs, the higher your breakeven ROAS will be.
- If you offer free shipping without factoring it into your sale price, you’re choosing to cover (literally) the cost free of charge.
Processing fees
Then there’s processing fees. This is one that many sellers forget to consider, mostly because they seem too small to make a big difference, but they add up.
What seems like 2-3% initially ends up being double that.
Once you add chargebacks, fraud tools, and international fees, you’re looking at 3–5% before you even add ad spend into the mix.
Returns
Returns are another cost that often gets missed. Let’s say 10% of orders come back, your “sales” number is no longer accurate. You can avoid this anomaly by using the net sales figure to do your breakeven calculation – not gross sales, which don’t factor in refunds. Otherwise, you might end up scaling campaigns that look profitable, but in reality, they’re not.
Seasonality & discounts
Seasonality and discounts can mess your calculations up, too. Think Black Friday discounts, and Christmas holiday, and EFY sales. Shipping can spike during these times, and the discounts you provide will eat into margins. This means inventory costs will increase, too. So you can be sure your December breakeven ROAS won’t be what your March breakeven ROAS is, so don’t assume it’s the same year-round.
To sum it up: Margins may be your primary determinant toning factor when it comes to understanding your true breakeven ROAS, but there are other factors that can impact your final figure. Make sure you account for all the factors above and calculate your breakeven ROAS often, so it tells the true story of your ad spend during different times of the year.
Industry-specific breakeven ROAS considerations
Every industry operates in its unique way. When looking at breakeven ROAS, it’s difficult to establish clear best practice benchmarks because the reality of the market always needs to be taken into consideration.
- E-commerce: Fashion and electronics tend to deliver higher breakeven ROAS, while home goods and niche products (which often have better margins) often end up with a lower breakeven target.
- SaaS: With software sales, the real breakeven ROAS often depends on lifetime value (LFV). Recurring revenue means you can afford to lose some money on the first month, if it pays off in the long run.
- Digital products: Because there are no shipping or inventory fees, there isn’t much to eat into the margin. This means the breakeven ROAS for digital products (courses, e-books, or templates) is one of the best in the market.
Using breakeven ROAS for campaign optimization
When you know your breakeven ROAS, you can use it as your guiding baseline and the driver of all your ad campaigns.
For each ad account, set a minimum ROAS target so campaigns pause (or slow down) on their own when they reach the breakeven point. This will save you from keeping bad ads active.
Also, when you review campaigns, ask a simple question:
Are we above or below breakeven?
If a campaign is:
- 20% or more above = It’s earning more budget
- Just a little above = Rework the ad before scaling
- Below breakeven = Change something immediately, or drop it altogether
When you take this approach, you’ll quickly spot the weak ads and scale the ones that are working like a dream.
- In Google Ads: Sort by ROAS, and you’ll see the problem ads immediately.
- In Meta Ads: Add custom columns for your actual ROAS and your breakeven target so you can spot ad performance at a glance.
When you know what’s working and what isn’t, you can reallocate your budget accordingly. Take the spend from anything below breakeven and move it to the winning ads. Even just making that one move can boost your profit without sending your ad designs and landing pages back to the creative team.
You could even set up a simple ROAS action framework that keeps everything consistent:
- 20% or more below breakeven: Take action now
- Within 10% of breakeven: Optimize
- 10–20% above breakeven: Watch closely
- 25%+ above breakeven: Scale now
Tip: Avoid making decisions on one day of data. A single dip doesn’t mean a campaign is doomed or dying. Try to use a rolling 7-day and 30-day average. This will give you a more realistic picture of the ad campaign’s actual value.
What to do when campaigns fall below breakeven
If a campaign drops below your breakeven ROAS, don’t just sit back and “wait it out”. Pause it and stop wasting budget. In fact, you can pause entire ad groups if it’s clear they’re dragging down performance. From there, move to trim budgets on the ones that are slightly unprofitable while you work out what you can change to switch their direction.
In some cases, just breaking even might still be worth sticking to and pursuing. For example, if your customer is worth $200 over their lifetime and the first purchase just covers acquisition, that’s still going to deliver a win in the long run. Keep in mind that not every campaign needs to be profitable from day one. This is definitely the case if you’re buying customers, not just transactions.
In many cases, to improve ROAS, you’ll start by fixing the landing page. Try a new angle, play around with your pricing, and fix the copy. Even a small change in the conversion rate (say 10%) can turn an ad campaign that’s just getting by into a solid winner. Also, a clear value statement and quick checkout can go a long way in online sales.
Another thing that can work is reevaluating who you’re targeting. Tighten your target audience. Cut out those that never convert, and build lookalikes from your top customers. Many “bad” campaigns aren’t actually bad; they’re just targeting the wrong people.
And give your ad campaigns the time they need to work. In most cases, campaigns need 7–14 days for data that actually means something. Don’t go crazy on spending during this period, but give it time to show you if it’s delivering results.
Finally, there will be times when you have to face facts. There are products out there that simply don’t perform through paid ads. Full stop. Dropping those campaigns and moving your budget to the campaigns that work will end up doing more for your bottom line than trying to fix the unfixable.
Common breakeven ROAS mistakes and limitations
The most common breakeven ROAS mistakes come from missed costs, the wrong figures, and miscalculations.
Some of the additonal costs sellers forget include which eat into their margins include:
- Customer service time
- Return handling
- Chargebacks
Many also mix up net and gross margins, which give you vastly different figures, so you think you’re doing really well, when in reality you’re calculating the wrong numbers!
So bad math is a bit of a killer here. Some businesses calculate margins off the Manufacturer’s Suggested Retail Price (MSRP) instead of what they actually sell the goods for. And then others ignore variable costs (support hours or fraud tools).
We get that these calculations can get overwhelming, but you’ll solve half the problem if you have reliable and real transaction data.
Another point of error is updating costs. Shipping rates shift. Payment fees move with volume. Supplier prices go up or down. If you’re not updating your breakeven ROAS and using the updated numbers, your calculations are misleading you.
On top of that, we need to be real about the limits of what breakeven ROAS can tell you. When you’ve got multiple revenue streams, subscriptions, or long customer lifetimes, calculating breakeven ROAS can get messy. Also, don’t expect it to reflect things like brand value, customer quality, or market share (all legit reasons to accept a short-term loss!).
So remember to look at the big picture. Using breakeven ROAS as your only indicator of success can lead you to miss bigger strategic brand and marketing decisions. There will be times when running below breakeven makes good business sense.
Some of those times include when you’re:
- Trying to grab market share
- Block a competitor
- Build a stronger customer base
So Breakeven ROAS is just one metric that you can use to understand the health of your business and to guide your strategy – but it’s not the only one.
Tools and implementation for tracking breakeven ROAS
Tracking breakeven ROAS can be complex. However, if your numbers are accurate and if they all live in one place, it will be that much easier. Sure – you can use calculators and spreadsheets, but those will only work if the data you’re feeding them is correct. That’s why it makes good business sense to use real tracking platforms, like RedTrack.
RedTrack is built for tracking. It collects and stores all your costs, conversions, and revenue from every channel and shows you the real ROAS (not the polished numbers you get inside ad platforms). With cost updates made every 5 minutes and 200+ app integrations, you always know where each campaign is at. So you will never again have to guess your breakdown ROAS.
And sure, you might have Google Ads or Meta Ads, where you can set up conversion value tracking and target ROAS bidding. We know that will work (to and extent) – but only if the platforms get clean, accurate conversion data.
With RedTrack’s server-side tracking and CAPI integrations, we fix the gaps created by iOS14, browser limits, and lost pixels. So by having clean, accurate data, which RedTrack provides, Google and Meta can actually optimize for profit instead of random signals.
And if you’re on Shopify or WooCommerce, RedTrack will also connect your actual product costs and margins to your ad performance. So, instead of using multiple apps and hoping all the math adds up, you get a one source of truth. The one that alerts you every time a campaign slips below breakeven.
So who are the people that love us most? Media buyers, because our tool lets them cut bad campaigns loose fast, and scale the winners even faster through one single tool.
While you still might like to use your spreadsheets for custom scenarios, let RedTrack handle the real-time monitoring, cost syncing, and attribution work.
Use RedTRack’s automations to make breakeven ROAS part of your daily workflow. Pause or downscale campaigns instantly when they underperform, and raise the budget for the campaigns that outperform.
With RedTrack’s custom reports (including a 30-day rolling view), you can spot trends early, make changes quickly, and use the numbers as rationale for all your ad spend decisions.
Markets change, margins move, and breakeven targets shift. With RedTrack, you always have real-time data to help you make the most effective ad spend budget decisions.