When it comes to digital publishing, understanding your metrics is the difference between scaling profitably and leaving money on the table. Two of the most important, yet often confused, are CPM vs RPM.
Both measure how your ads generate income, but they serve different purposes in calculating estimated revenue. Publishers who don’t understand the distinction risk misjudging ad performance and undervaluing their content.
In a nutshell, CPM tells you how much advertisers are willing to pay per thousand impressions, while RPM reflects what you actually earn for every thousand page views.
Knowing the difference helps you evaluate the true profitability of your ad strategy and optimize for maximum revenue growth so in this article, we’ll break down RPM vs CPM in simple terms, show how they impact your ad revenue, and explain why publishers who get this right make smarter, more profitable decisions.
Understanding CPM and RPM: The Fundamental Difference
The debate around CPM vs RPM often comes down to perspective. CPM (Cost Per Mille) reflects what advertisers pay for 1,000 ad impressions during an ad campaign, while RPM (Revenue Per Mille) shows how much revenue publishers actually earn per 1,000 page views. On paper, both use the “per thousand” model, but the impact on your bottom line is entirely different.
Here’s the thing: CPM is advertiser-focused, sitting on the cost side of a campaign before revenue sharing or platform fees. It answers the question: “How much does it cost to reach my audience?” RPM, on the other hand, is publisher-focused. It shows the real revenue you keep after deductions.
Naturally, both metrics matter. CPM tracks how valuable your inventory appears to advertisers, while RPM captures the true effectiveness of your monetization strategy. And the worse thing about confusing them? You may think you’re maximizing revenue when in reality, low fill rates, platform cuts, or underperforming ad units are eating into your profits.
What is CPM (Cost Per Mille)?
CPM (Cost Per Mille) is the price an advertiser pays for every 1,000 impressions – with “mille” meaning “thousand” in Latin. In simple terms, it’s the cost of buying ad space on a website or platform, before any revenue sharing or platform fees are applied.
When you see CPM rates inside an ad network or programmatic platform, you’re looking at the gross amount advertisers are willing to invest to reach your audience. That number can shift dramatically depending on industry vertical, seasonality, audience demographics, and geographic location.
The model is especially common in display and programmatic buying, where the goal is reach and awareness rather than direct conversions. Video ads, native formats, and premium placements often come with higher CPMs because they drive stronger engagement – and, when optimized well, can ultimately translate into greater ad revenue for publishers.
How to Calculate CPM
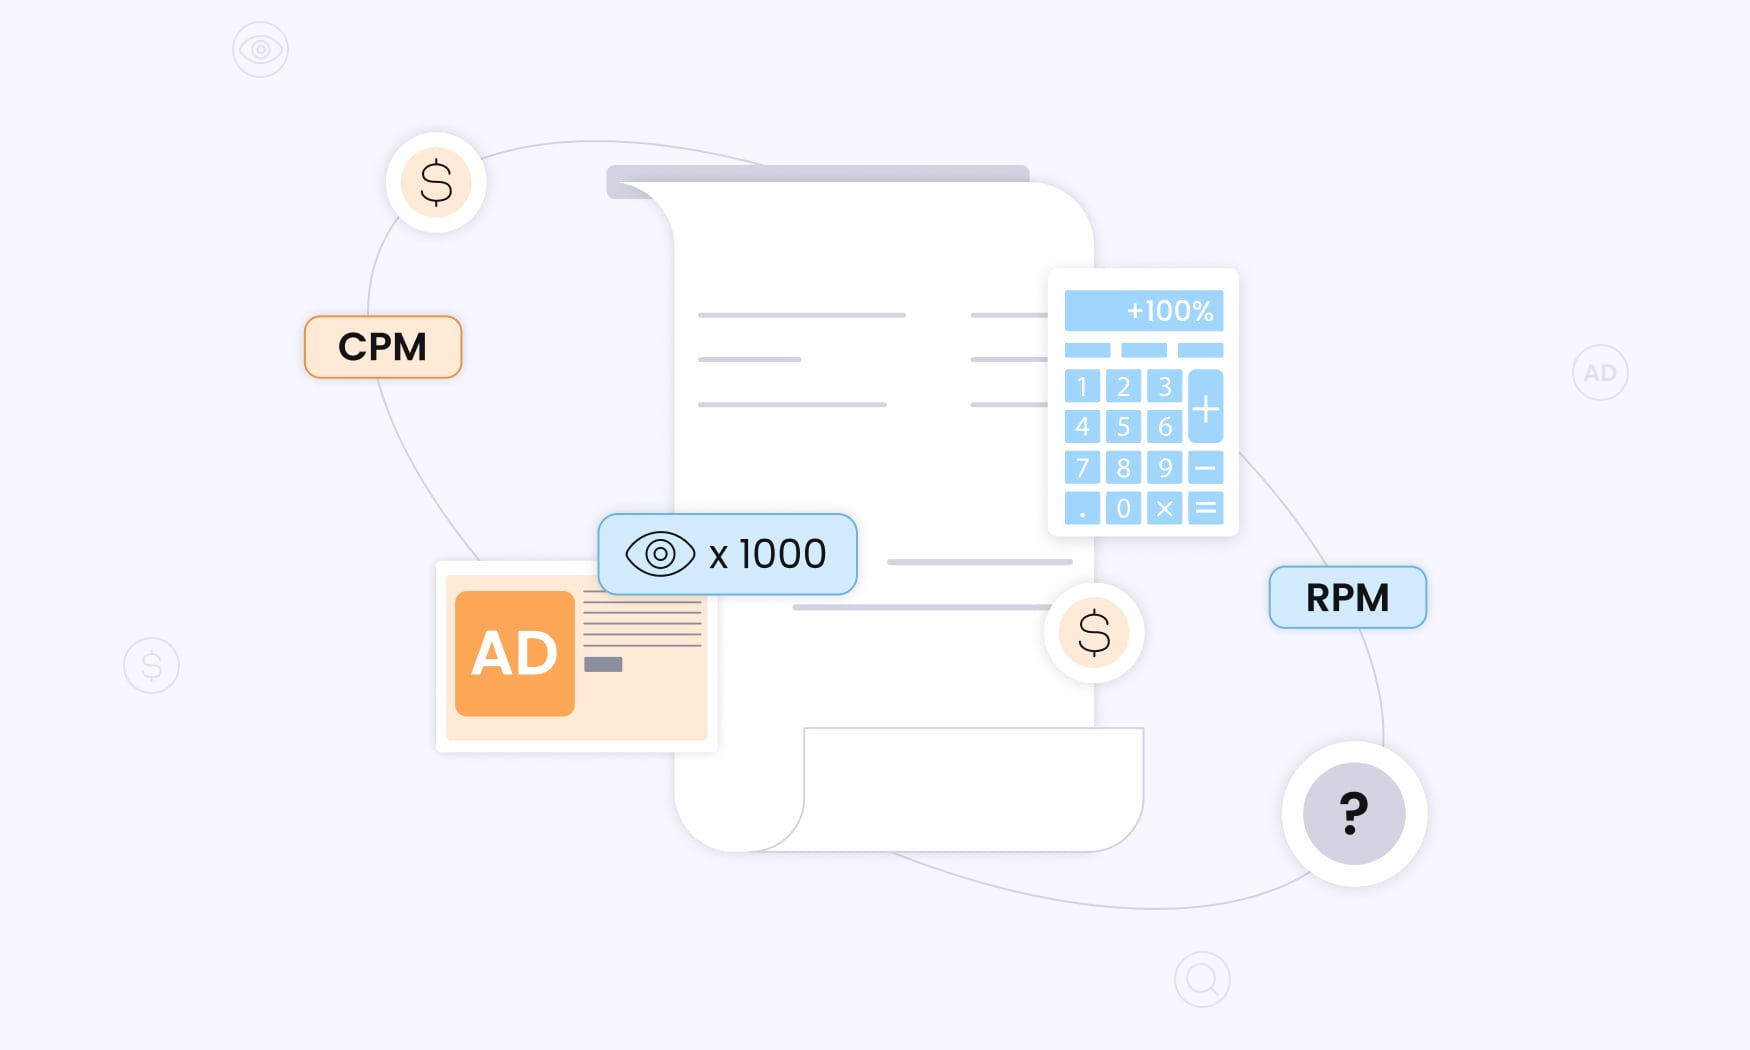
The formula for CPM is simple:
CPM = (Total Campaign Cost ÷ Total Impressions) × 1,000
For example, if an advertiser spends $500 on an ad campaign that delivers 100,000 impressions, the CPM is $5.
Why does this matter? For advertisers, it’s a budgeting tool. CPM lets you compare costs across ad networks, formats, and targeting options. You can quickly see if paying more to reach a niche audience is worth it – or if broader targeting delivers better value.
Publishers also gain by knowing their CPM. If programmatic partners typically deliver $3 CPM, you can benchmark your ad space and set competitive rates in direct deals.
Of course, real-world CPM isn’t always this clean. Multiple ad units, different formats, and varying fill rates complicate things. That’s why most networks automate the math – but understanding the calculation yourself means you can spot gaps, interpret ad revenue performance better, and optimize with confidence.
Why CPM Matters for Publishers
For publishers, CPM is more than just a pricing number – it’s a window into how advertisers value your audience. By tracking CPM across different ad placements and formats, you can see which content categories, page positions, and audience segments attract higher bids. That insight helps shape both your content strategy and monetization plan.
CPM also reflects advertiser demand across ad networks and exchanges. During an ad campaign, higher CPMs usually mean strong competition for your inventory, signaling audience segments worth additional focus or investment.
Seasonality plays a role too. Premium CPMs during peak shopping periods can boost the revenue generated from your ad space, while slower months highlight when to adjust expectations or optimize for efficiency.
And here’s the thing – CPM knowledge strengthens negotiations. When you know the going market rates for your demographics and content, you can set competitive prices with direct advertisers while protecting profitability.
The result? Smarter inventory management and stronger, long-term advertiser relationships.
What is RPM (Revenue Per Mille)?
RPM (Revenue Per Mille) measures the estimated ad revenue a publisher earns per 1,000 page views. Unlike CPM, which looks only at the cost of individual impressions during an ad campaign, RPM captures the full earnings across all ad units on a page. That makes it a more complete picture of real monetization performance.
Here’s the key difference: CPM shows what advertisers are willing to pay, while RPM reflects what you actually keep after revenue sharing and platform fees. For example, when Google AdSense reports RPM, it’s showing your net earnings after their commission has already been deducted.
RPM is also broader in scope. It doesn’t just cover display ads, but it factors in video ads, affiliate links, sponsored placements, and any other monetization methods contributing to overall ad revenue.
By analyzing RPM, publishers can identify which pages, topics, and audience segments generate the most value. That insight guides smarter content strategies and ensures resources go toward the parts of your site that consistently deliver profits.
How to Calculate RPM
The formula for RPM (Revenue Per Mille) is straightforward:
RPM = (Total Revenue ÷ Total Page Views) × 1,000
For example, if your website generates $300 from 50,000 page views, the RPM works out to $6.
Unlike CPM, which looks at impression costs during an ad campaign, RPM focuses on page-level performance. That makes it a clearer indicator of how well you’re monetizing traffic. In practice, page RPM is the go-to metric for publishers because it shows estimated ad revenue per 1,000 visits, across all ad units and formats on a page.
You can also drill down by audience segment – geography, device type, or content category – to uncover where monetization opportunities are strongest.
Tracking RPM trends monthly or quarterly reveals patterns that help you forecast earnings, refine content investments, and set realistic revenue targets. In short, understanding RPM isn’t just math, but the foundation for smarter, long-term growth.
Why RPM is Critical for Publishers
RPM offers the clearest view of your actual earnings from website traffic, which makes it indispensable for business planning and long-term monetization strategy. Unlike metrics that look at a single ad unit or placement, RPM reflects the combined performance of everything on a page, giving you the big picture of how well your site is truly working for you.
By analyzing RPM, you can pinpoint your most profitable content and placements.
The best part? Once you know which pages deliver the strongest RPM, you can replicate those winning elements across your site and allocate resources where they’ll drive the most return.
This metric also ties together traffic quality, content value, and revenue generation. It helps you balance user experience with monetization goals, ensuring you grow sustainably without frustrating your audience.
Finally, RPM makes comparison easy. Whether it’s across different sections, time periods, or optimization efforts, RPM tells you if your strategies are working. For publishers running an ad campaign or scaling content output, this insight is crucial to maximizing long-term profitability.
CPM vs RPM: Key Differences Explained
The differences between CPM and RPM go far beyond definitions – they directly influence how you approach monetization and revenue optimization. Understanding these distinctions is what allows publishers to make smarter decisions about ad strategy and performance evaluation.
| Aspect | CPM | RPM |
| Perspective | Advertiser cost | Publisher revenue |
| Calculation Base | Ad impressions | Page views |
| Revenue Sharing | Excludes platform fees | Includes actual earnings |
| Scope | Individual ads | All page monetization |
| Typical Values | Often lower per impression | Often higher per page view |
The first difference is perspective. CPM reflects what advertisers pay in the broader ad ecosystem, while RPM shows what publishers actually keep. That gap often represents platform fees, commissions, and other costs that reduce your estimated earnings compared to gross advertiser spend.
Next comes calculation. CPM is based on ad impressions – every time a single ad is displayed. RPM, however, uses page views, which often include multiple ad units and revenue streams. As a result, RPM may appear higher, since it captures all the monetization happening on a page.
Finally, scope matters. CPM optimization zooms in on individual ads, their targeting, and placement. RPM optimization takes a holistic view, looking at the entire page experience – ad density, content strategy, and the interplay of multiple revenue sources.
Both matter, but in very different ways.
Factors Affecting CPM and RPM Performance
Both CPM and RPM are influenced by a wide range of external factors. While you can’t control everything, understanding these levers helps you adjust strategy, set realistic benchmarks, and uncover opportunities to improve estimated earnings from your ad space. Let’s break down the key drivers:
Geographic Location
Where your traffic comes from has a direct impact on both CPM and RPM.
Tier 1 countries like the United States, United Kingdom, and Canada usually command the highest rates because advertisers value their purchasing power and strong consumer intent.
Traffic from Tier 2 and Tier 3 regions often brings lower CPMs and RPMs – but can still be valuable if scaled effectively or paired with niche targeting.
Seasonality
Advertising spend follows predictable patterns, and so do CPM and RPM.
The Q4 holiday season often sees 20–40% higher rates as advertisers pour budgets into shopping-related ad campaigns. Conversely, January tends to be slower, with reduced competition and lower rates. Publishers who align content calendars with these trends can maximize performance during peak demand and optimize inventory during quieter periods.
Content Niche
Your niche determines advertiser demand (to a certain extent).
Finance, technology, business, and health content usually draw premium CPMs and RPMs thanks to highly competitive industries.
Meanwhile, entertainment and lifestyle niches may earn less but make up for it with broader audience reach. Knowing which niches deliver the strongest ad revenue helps guide long-term content investments.
Ad Placement
Placement on the page significantly affects both metrics.
Ads placed above the fold (visible without scrolling) often perform 30–50% better than those below the fold. Better viewability translates into higher CPMs and stronger RPMs. Publishers should continuously test placements to strike the right balance between revenue optimization and user experience.
Audience Demographics
Advertisers assign value based on who’s visiting your site.
Younger audiences often attract gaming, streaming, and lifestyle brands, while professional, high-income demographics appeal to B2B and finance advertisers willing to pay higher CPMs. Segmenting traffic by demographics helps identify where the greatest revenue opportunities lie.
Device Type
Desktop traffic typically generates higher CPMs than mobile because of larger ad formats and more engagement-friendly browsing.
However, with mobile now dominating global traffic, publishers can’t ignore mobile optimization. A well-optimized mobile experience can boost RPM by increasing page views, ad engagement, and time on site.
Ad Format Variety
Not all ad formats are created equal!
Video ads, native ads, and rich media units consistently outperform standard display ads. Premium and interactive placements often command higher CPMs and drive more meaningful revenue generation – but they need careful implementation to avoid harming user experience.
The bottom line is that each factor shapes how much value you capture from both CPM and RPM. By tracking and testing these variables, publishers can turn raw traffic into predictable, scalable earnings.
When RPM is Higher Than CPM (and Vice Versa)
The truth is, the relationship between RPM and CPM isn’t always neat and tidy. Quite often, RPM ends up higher when multiple ad units push total revenue per page view up.
Picture this: three placements at $2 CPM each give you a $6 RPM.
Same audience, same traffic – just smarter use of ad space.
RPM also gets a lift when you layer in other revenue streams. Affiliate links, sponsored content, subscriptions, even product sales – they all add to your estimated earnings, while CPM only tells the story of a single ad campaign. And if you’re using header bidding or similar tech, RPM can pull ahead again because competition drives prices up and fill rates improve.
But it’s not always good news. CPM might look stronger than RPM if ad blockers eat into your real revenue, even though advertisers are still paying.
Platform fees create another gap – YouTube is the classic example where reported CPM looks healthy, but actual RPM is much lower. And let’s not forget the technical stuff: slow pages, clunky ad loads, or poor mobile setup hit RPM hardest, since fewer ads are actually seen.
The bottom line? CPM shows what advertisers pay. RPM shows what you keep. Tracking both side by side is the easiest way to spot leaks in your ad strategy and make sure your monetization game stays sharp.
Which Metric Should Publishers Focus On?
When it comes to CPM vs RPM, the smart move for publishers is to focus on RPM for the big picture.
Why?
Because RPM reflects actual earnings after fees and revenue sharing, giving you the clearest sense of business performance.
It’s the metric that helps you monitor ad revenue, plan content investments, and prioritize audience growth strategies with confidence.
That said, CPM isn’t irrelevant.
It’s still an important lens into advertiser demand and market conditions. Tracking CPM data shows you when certain audience segments or ad formats are in high demand, which helps you set competitive pricing for direct sales and spot seasonal revenue opportunities.
The best approach? Use both.
RPM tells you whether your overall monetization strategy is paying off, while CPM highlights specific ways to boost the value of your ad inventory – like improving placements, refining targeting, or developing premium content categories.
Naturally, combining CPM and RPM with other performance signals – click-through rates, viewability, engagement – gives you a full view of your site’s monetization health. This balanced approach ensures you’re not just chasing higher numbers, but building a sustainable ad strategy that maximizes both revenue and user experience.
CPM vs RPM? Let RedTrack Help You
Understanding CPM vs RPM is more than theory – it’s the key to building profitable monetization strategies.
CPM shows advertiser demand, while RPM reveals your actual earnings after fees, commissions, and fill rates. Together, these metrics allow you to monitor ad revenue, optimize placements, and make smarter long-term decisions about content and monetization.
The challenge for many publishers is fragmentation.
Data is scattered across different ad networks, each showing a slightly different view of CPM and RPM. Add in the complexity of multiple advertising campaigns, seasonality, and shifting platform rules, and it’s easy to miss what’s really driving your revenue.
That’s where RedTrack makes a difference.
Instead of juggling separate dashboards, RedTrack provides a single source of truth for all your performance data.
You can see CPM and RPM side by side across networks, enriched with conversion insights and accurate attribution.
This clarity eliminates the confusion of fragmented reporting and ensures you understand both what advertisers are paying and what you’re actually earning.
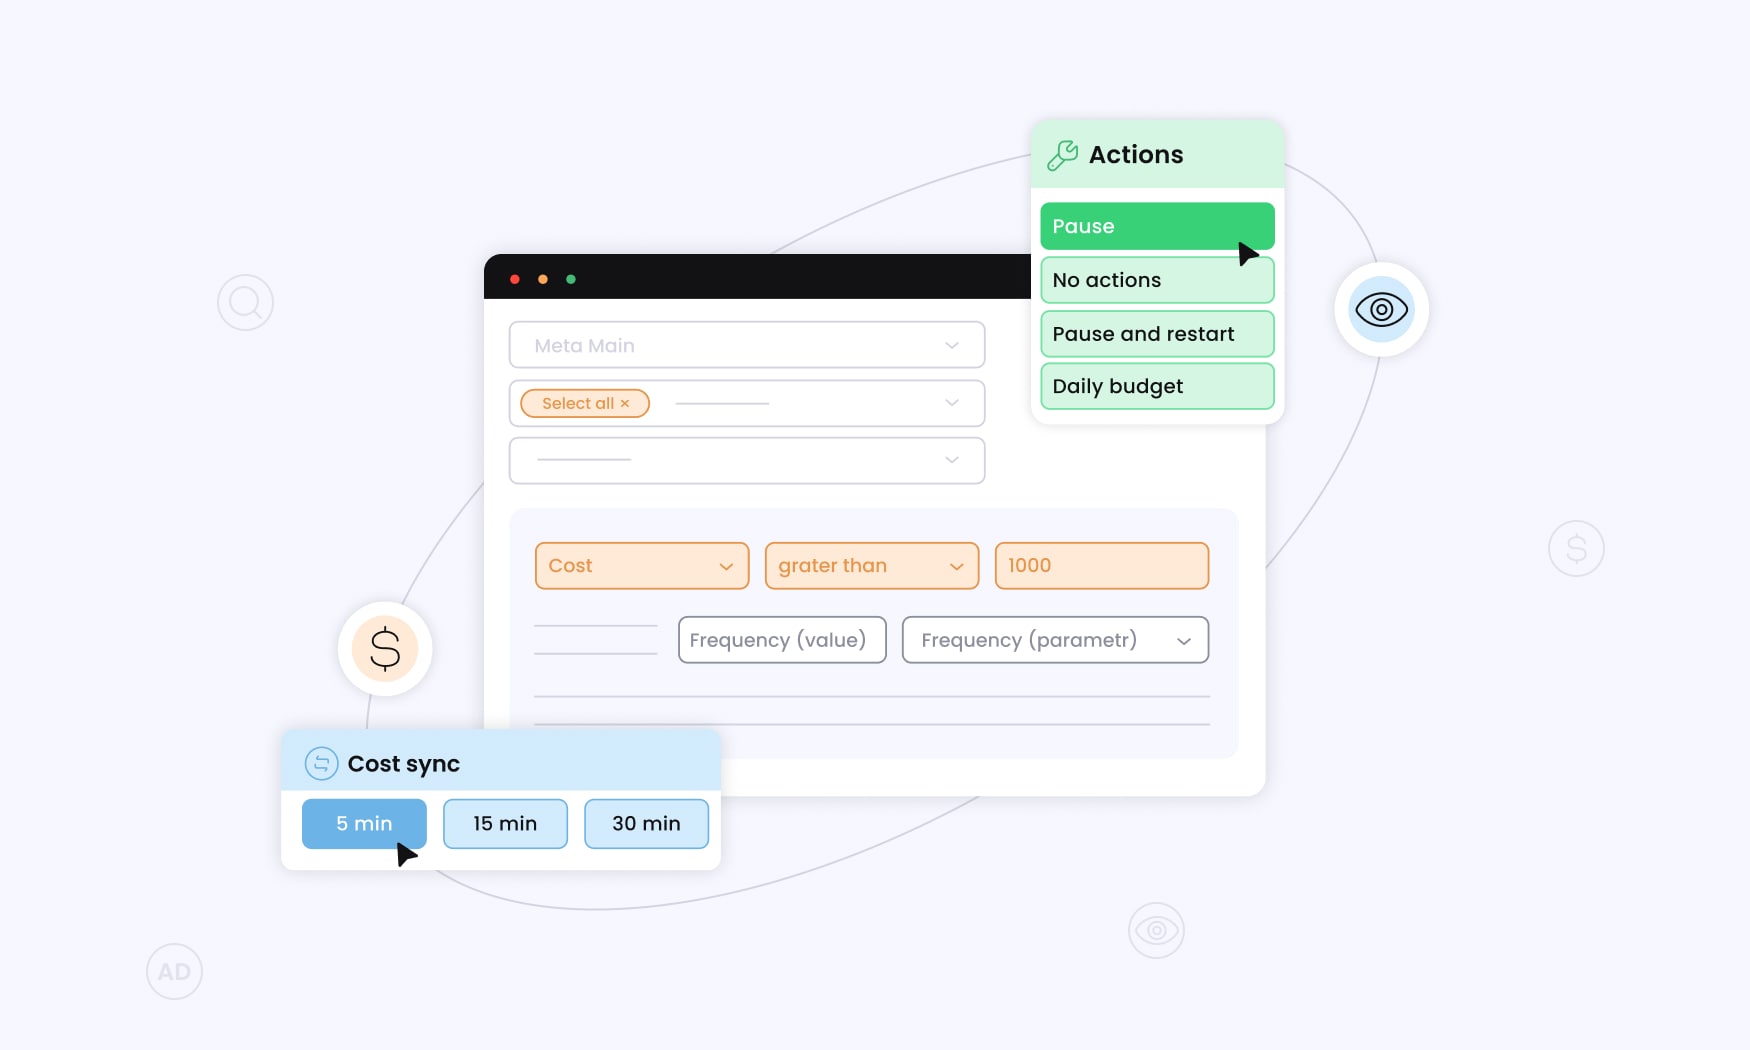
Beyond visibility, RedTrack empowers you to act.
With server-side tracking, automated rules, and real-time reporting, you can optimize faster – pausing underperforming placements, scaling profitable segments, or negotiating better deals with partners.
In short, you stop wasting time reconciling numbers and start making confident, data-driven decisions.
With RedTrack, publishers finally gain the clarity and control to turn cpm vs rpm analysis into sustainable revenue growth.