As an e-commerce store, you’re probably sitting on a heap of customer data. For those of you who are already all into it and on top of it, you know how valuable the buyer data insights are, and you’re using them to generate new leads. But for those of you who aren’t, you are quite literally sitting on a cash cow.
Yep – that’s right, your customer purchase data is one of the biggest and best, low-investment revenue-generating machines.
The problem is, not everyone is using that data to their advantage by applying the RFM segmentation strategy.
RFM segmentation is a customer analysis method that invites you to divide customers into actionable segments based on their actual purchasing behavior. While most brands treat all customers as one group, sending the same emails and offering the same discounts, RFM segmentation savvy marketers go and create customer groups based on recent purchasing behavior.
And when they do that, they get a better understanding of which customers need a little more love and care, and which ones deserve to be rewarded for being loyal, regular buyers.
So if you’re new to RFM segmentation and you notice your marketing strategies and campaign performance are on a continuous decline, we’ve got you covered.
It doesn’t matter if you run a subscription service or a direct-to-consumer product; the process is the same for all buyers. So in this blog, we’ll explain and walk you through the RFM segmentation strategy that will teach you how to get a deeper understanding of your customer groups. That way, you’ll know how to target each group with the right intention and campaigns so you stop wasting money on ineffective ads and marketing strategies.
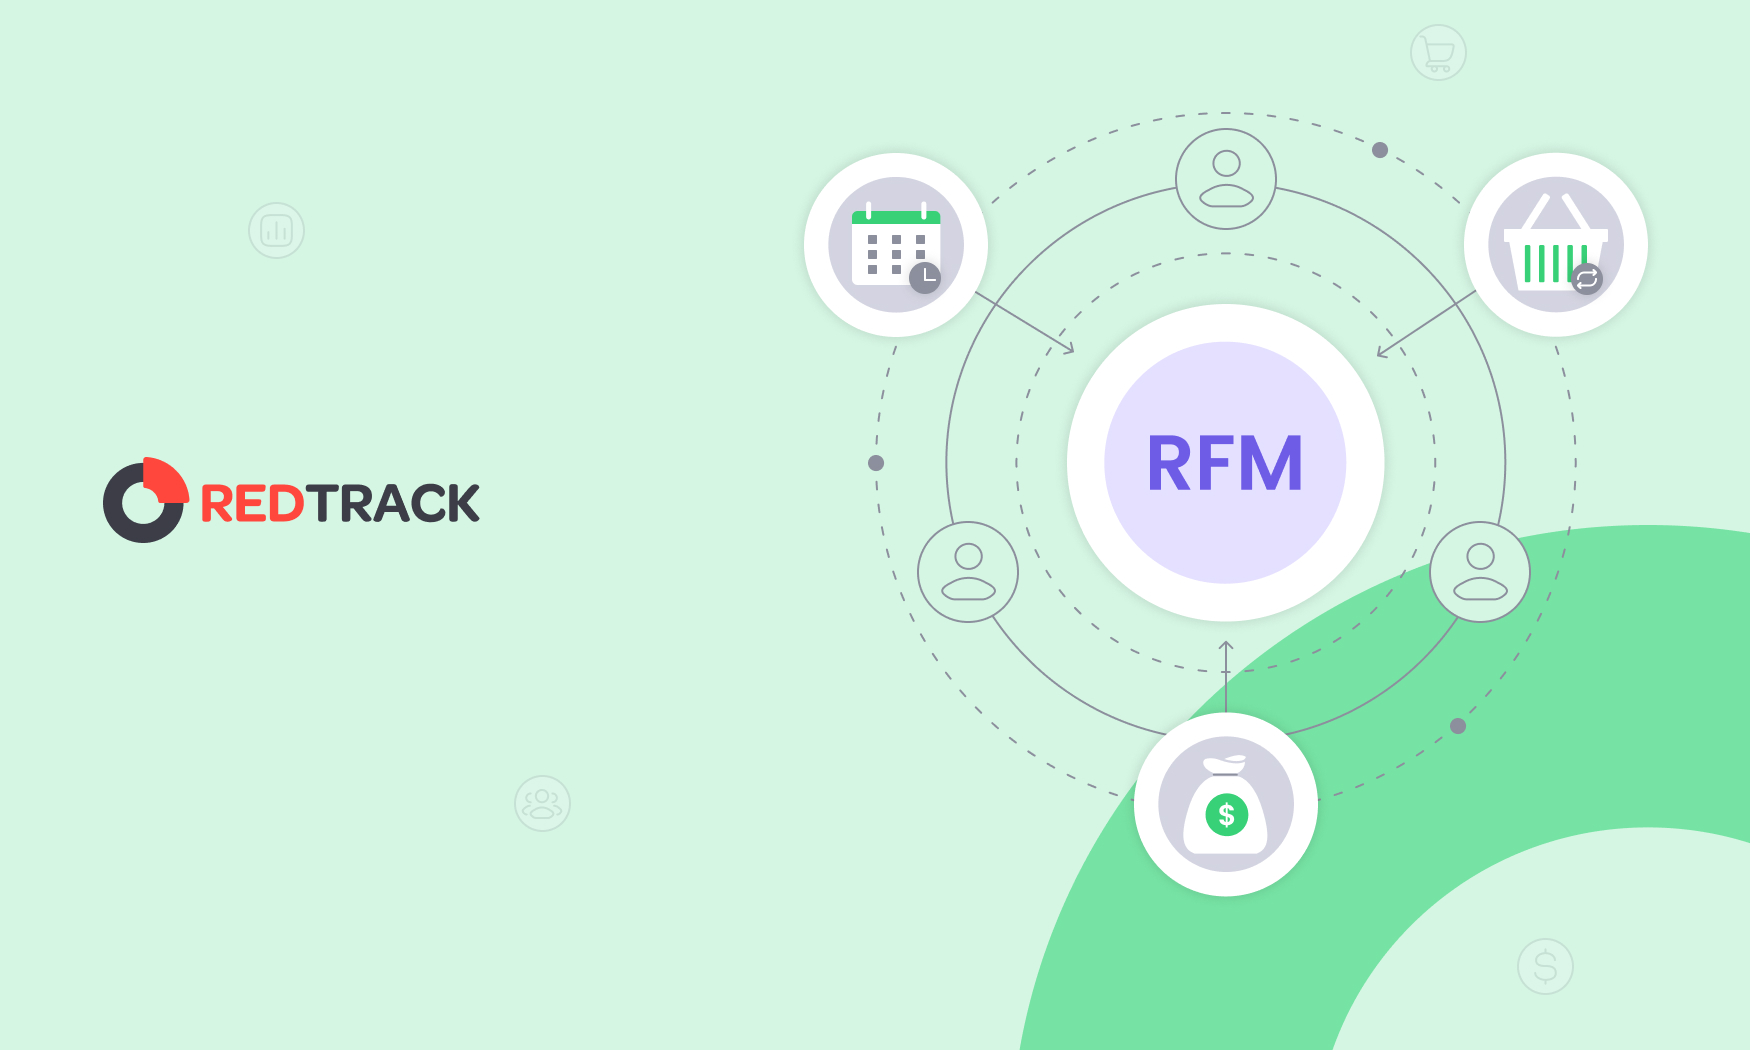
What is RFM Segmentation?
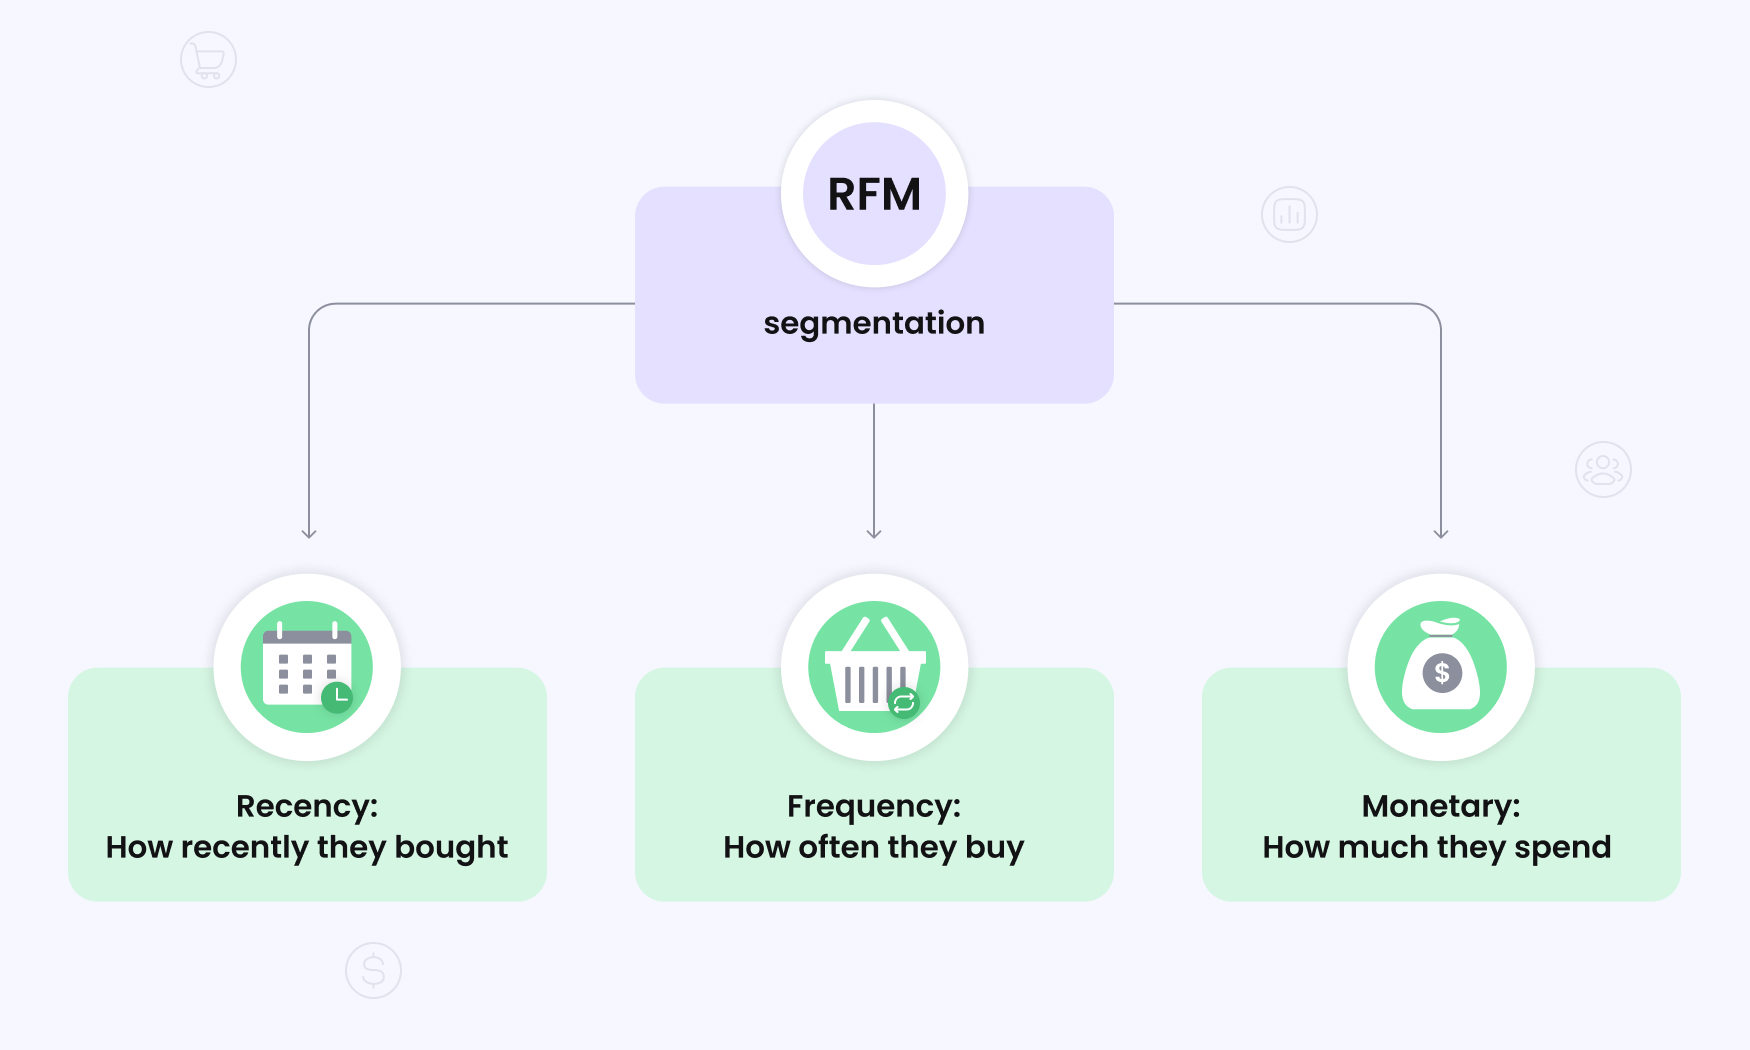
At its core, RFM (Recency Frequency Monetary) segmentation is a behavioral customer segmentation method that lets you group customers based on the three dimensions of purchase history:
- Recency: How recently they bought
- Frequency: How often they buy
- Monetary: How much they spend
It’s one of the easiest ways for e-commerce and subscription businesses to identify their most valuable customers so they can make the right marketing outreach decisions.
One thing to note with this method is that, unlike demographic segmentation, which relies on age, gender, or location, RFM customer segmentation depends entirely on historical customer transaction data.
What you get as a result is clear-cut data insights that let you group customers into specific categories, like:
- Champions – These are all your recent, frequent, high-spending customers
- Big spenders – These are your high monetary value customers (hence “big spender”), but who might not make frequent purchases
- At-risk – These are your previously top-notch customers who haven’t made any purchases recently
- Hibernating – These are your least engaged customers (hence “hibernators”) who haven’t made any or very few recent purchases of low monetary value
Why is RFM Segmentation Important in Marketing?
What RFM segmentation does is create a connection between your real-life customer behavior data and gives you a glimpse into the metrics your marketing teams care about and work for most.
These include:
- Customer Retention
- Customer Lifetime Value (CLV)
- Campaign ROI
On top of that, it also helps you divide your customers (segment) into groups with similar behaviors and purchase potential. So, instead of blasting your entire customer list with the same offers, RFM lets you take a targeted approach where you allocate more budget to the groups where the return is more likely.
Here are some of the logics marketers use across the three dimensions RFM measures:
- Recency (R): The customer who bought last week is much more likely to make another purchase soon than the one who bought a year ago.
- Frequency (F): The customer who buys from you often or at regular intervals is more loyal and comes with a lower acquisition cost.
- Monetary (M): Some customers are big spenders, while others are bargain hunters. The two need to be approached in different ways, and they deserve different treatment.
So, using this logic, you, as a marketer, might decide to send early access invites and exclusive offers only to your “Champion” customers, while you send the occasional win-back campaign emails to your “Hibernating” customers.
Note: The other thing to remember here is that marketers combine their RFM scores with channel strategies and customer journey insights. While the RMF framework tells you who to target, your channel strategy tells you how to reach them.
What types of businesses does RFM segmentation work for?
The great thing about RFM segmentation is that it’s channel-agnostic. This means it works across industries, business types, and customer channels, including:
- E-commerce stores (think fashion, beauty, and home goods)
- Service businesses like subscription services (think meal kits, software, and media)
- Mobile apps (think gaming, food delivery, and fitness)
- Physical retail stores (those with access to customer data and set loyalty programs)
Setting the groundwork for proper RFM Analysis
Before you jump into organizing your customers into segments, you’ll need to do some foundational groundwork to set yourself up for proper RFM analysis.
RFM analysis involves:
- Choosing a set observation window
- Gathering and analyzing your customer data (so you see what you have to work with in terms of the size of of your customer list)
- Deciding which scoring scale and methodology works best (choose the ones that make the best sense for your business size and type)
We’ll explain all of these in detail below but before we do that, we need to stress two thing:
- The critical deciding factor that lies behind the efficacy and value of your RFM analysis and segmentation is the accuracy of your customer data.
- Your customer data is the one thing that’s going to make or break the results you achieve in your marketing strategies and campaigns.
Why Accurate Attribution Data is So Important in RFM Segmentation
RFM segmentation only works if the purchase and conversion data you use is high-quality. If there are holes in your transaction data, like missing or duplicate transactions, then your Recency, Frequency, and Monetary scores aren’t going to be worth much.
That’s why having a solid attribution system in place is so crucial. Tools like RedTrack help get your customer purchase data in order by tracking conversions on the server side and tying ad interactions to the real revenue they actually generated.
The other thing tools like RedTrack can do is help patch up the blind spots from:
- Cookie loss
- Ad blockers
- Disparate tracking setups
What you need is clean and complete customer purchase data that feeds your RFM model accurately.
The end result is customer scoring that’s actually clean, segments that you can actually trust, and a whole lot more confidence when you’re deciding which audiences to give a free pass to, which ones to try and win back, and which ones are just not worth bothering with.
So before you do anything else, make sure you have accurate, clean customer data. You might use your Customer Relationship Management (CRM) tool, an e-commerce analytics platform where your business operates, or a marketing automation or all-in-one analytics tool like RedTrack. Some teams also use custom lists they’ve created with clean data from a mix of sources.
Once you have this, the RFM analysis setup will be fairly straightforward.
1. Choosing the Right Observation Window for Your Business Type
First, you need to choose an observation window on which you’ll pull and base your customer data and analysis. Here, you should choose the period that’s best aligned to your business type and operation:
- Last 6 months – Ideal for e-commerce businesses with high purchase frequency and shorter product lifecycles
- Last 12 months – Ideal for businesses dependent on seasonal changes or a standard annual purchase cycle.
- Last 24 months – Ideal for businesses with long sales cycles and low purchase frequency but high monetary value, like SaaS businesses.
2. Selecting Your Scoring Scale
Then, you need to choose the scoring system scale you want to use:
- 1-3 Scale – This can also be “Low”, “Medium”, and “High” scoring scale, where 1 is lowest. This system is usually used by smaller businesses to make segmentation simple.
- 1-5 Scale – This is the industry standard, where 1 is the lowest, and 5 is the highest customer score. It’s usually used by businesses with high transaction volumes and repeat purchase patterns (such as e-commerce).
- 1-10 Scale – This is used for businesses with large-scale customer databases that have and need granular insights. The scores range from 1-10 and cover a broad range of behavioral differences.
3. Choosing a Scoring Methodology
Next, you need to choose a scoring methodology to use in order to work out which customers get which scores. You can choose between:
- Percentiles (Quantiles) – This is the most common method, and it’s where you sort all customers by a metric and then divide them into 3, 5, or 10 equal parts (corresponding to the scale system you chose above in step 2).
- Business-defined thresholds (Fixed amounts) – You, as the business, choose the thresholds that respond to each score. For example, you might give customers who spend $2000+ a score of 5, those who spend $1500-$2000 a score of 4, and so on.
How to do RFM Segmentation: From Raw Data to Segments
When you’ve set the foundations for RFM analysis, it’s time to do the calculations, allocate scores and land your customer segments.
To make it easier to grasp what you need to do in each step, we’ll use an example.
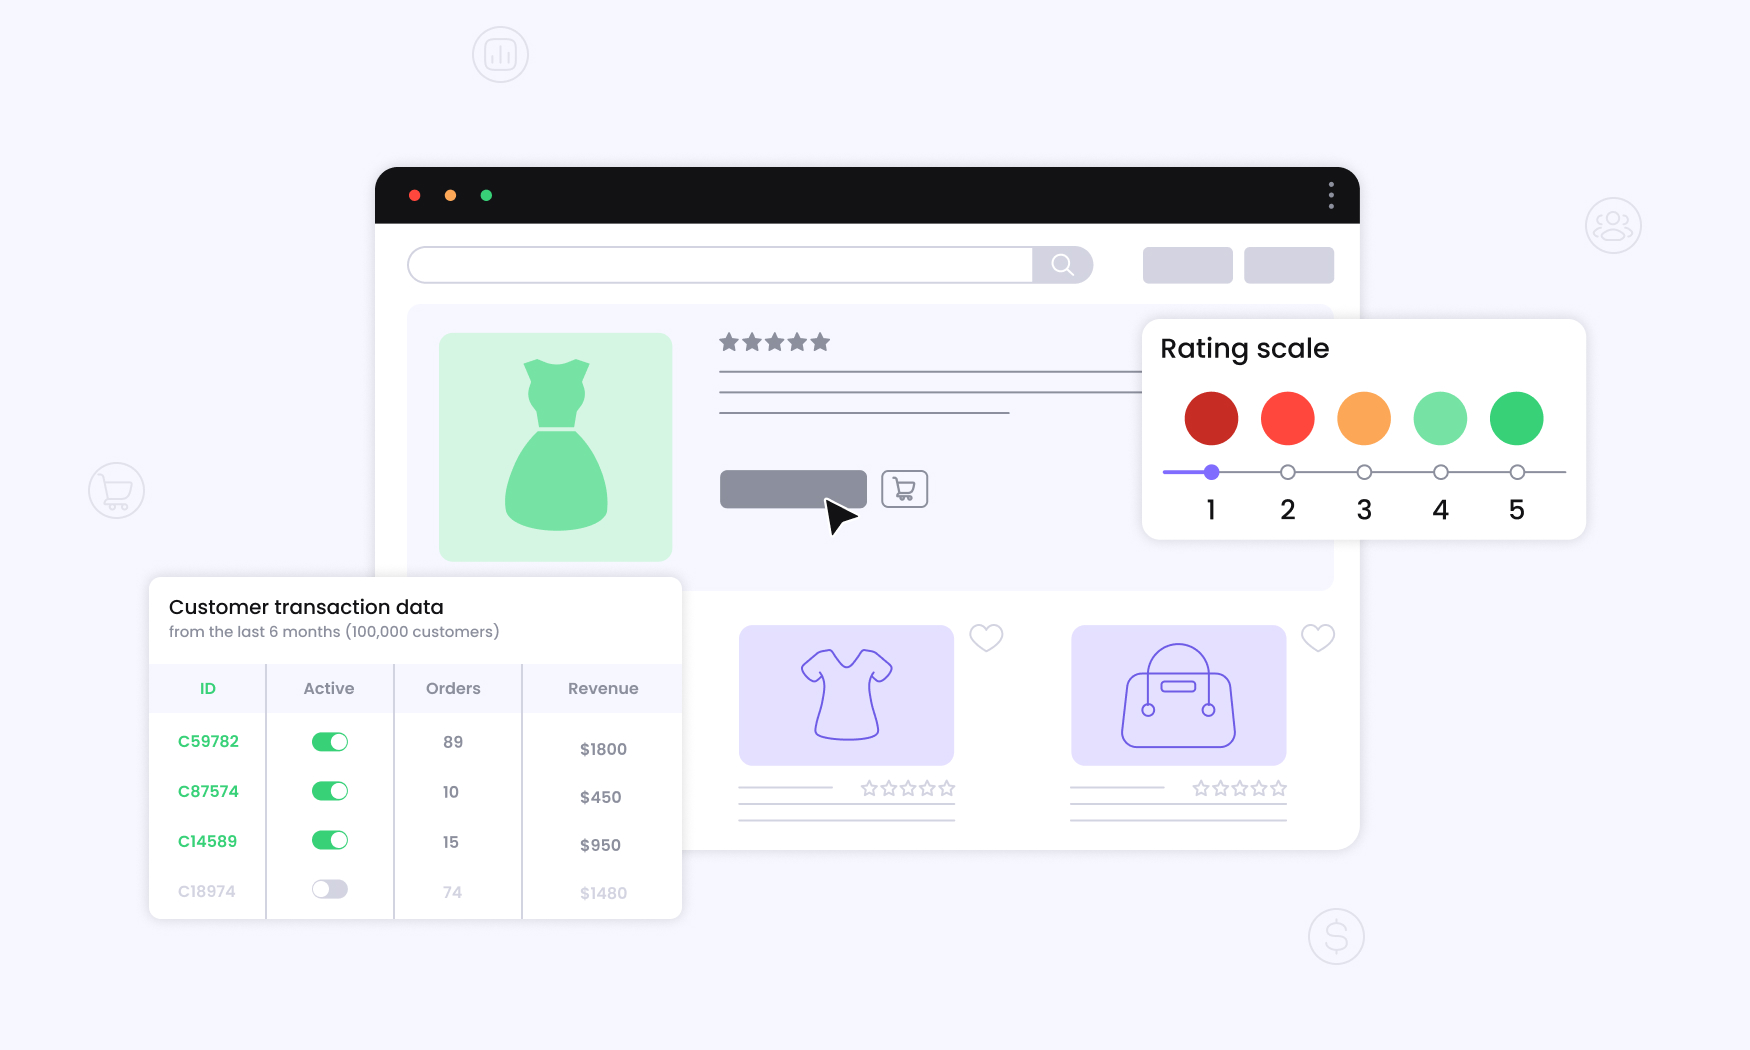
Let’s say we are doing RFM customer segmentation for a fashion e-commerce business.
We’ll be using:
- Clean customer transaction data from the observation window of the last 6 months (100,000 customers)
- A scoring scale of 1-5 (where the lowest score is 1 and the highest is 5)
- The percentile or quantile scoring methodology (divided into 5 equal parts)
Step 1: Assign Recency Value
Before you can assign a recency score, you need to decide the cut-off metrics you’re going to use to group your customers across the 5 percentile rank groups.
Here’s what we’ve chosen:
| Score | Recency Category | Cut-off Metrics |
| 5 | Morst recent buyers | 1-14 days |
| 4 | Recent buyers | 15-45 days |
| 3 | Mid-range buyers | 46-90 days |
| 2 | Lapsing buyers | 91-150 days |
| 1 | Inactive buyers | >150 days |
To calculate a customer’s recency you need to use the formula:
Recency = Analysis date – Last order date
If the buyer we’re analyzing last made a purchase in the last 10 days, here’s is what the calculation will look like:
Recency = 19 December – 9 December
Recency = 10 days
When you have this number, take a look at your recency score table and categories and see which one it fits into. In this case, our customer’s recency score is 5 because they last made a purchase in the last 14 days.
Step 2: Assign Frequency Value
Next, you’ll need to do the same type of table to decide on the frequency score cut-off metrics.
Here’s what we’ve chosen:
| Score | Frequency Category | Cut-off Metrics |
| 5 | Champion shoppers | 7+ orders |
| 4 | Frequent shoppers | 5-6 orders |
| 3 | Average shoppers | 3-4 orders |
| 2 | Infrequent shoppers | 2 orders |
| 1 | One-time & inactive shoppers | 1 or less orders |
To calculate a customer’s frequency, you need to add up the total number of orders the customer has made within the observation window.
Let’s say our customer made 5 purchases in the last six months. Using the data in the frequency table, this would place them in the “Frequent shoppers” category, giving them a frequency score of 4.
Step 3: Assign Monetary Value
Finally, do a table to rationalize how you will allocate scores across the monetary value of your customer orders and set the cut-off metrics.
Here’s what we’ve selected:
| Score | Monetary Value | Cut-off Metrics |
| 5 | Big spenders | >$1000 |
| 4 | High spenders | $600-$999 |
| 3 | Average spenders | $300-$599 |
| 2 | Low spenders | $100-$299 |
| 1 | Minimal spenders | >$99 |
To calculate a customer’s monetary value, add up the value of all the orders the customer made within the observation period.
If our customer made 5 purchases in the last month with the following order values, here’s what this calculation would look like:
Monetary Value = $150 (#1) + $69 (#2) + $350 (#3) + $150 (#4) + $340 (#5)
Monetary Value = $1059 (Total purchase value over the six month period)
This total purchase value amount would give our customer a monetary score of 5.
We now have all three RFM scores for this customer, and they look like this: 5-4-5
Step 5: Gather All Customer RFM Scores & Rank
When you have all the raw R, F, and M values, assign scores to place customers into distinct behavioral segments. Your data might look something like this:
| Customer ID | Recency (Score) | Frequency (Score) | Monetary (Score) | RFM Scores |
| C004 | 7 (5) | 15 (5) | $3,450 (5) | 5-5-5 |
| C001 | 12 (5) | 8 (5) | $1,240 (5) | 5-5-5 |
| C002 | 45 (4) | 3 (3) | $289 (2) | 4-3-5 |
| C005 | 92 (2) | 2 (2) | $156 (2) | 2-2-2 |
| C003 | 180 (1) | 1 (1) | $67 (1) | 1-1-1 |
Step 6: Create Combined Customer Segments
The second-last step is to create your combined customer segments based on RFM scores you’ve pulled from all the data and calculations.
This part is all about translating your RFM scores into actionable segments that make sense for your your marketing team.
You might choose to set up your customer segments with the following logic and definitions:
| Segment | Typical RFM Range | Strategic Intent |
| Champions | R≥4, F≥4, M≥4 | Retain, reward, advocate |
| Loyal | F≥4, M≥3, R≥3 | Deepen relationship |
| Big Spenders | M≥4, F≤3 | Increase frequency |
| Potential Loyalists | R≥4, F=2-3, M≥3 | Nurture to loyalty |
| Promising | R≥4, F=1-2 | Drive the second purchase |
| About to Sleep | R=2-3, F≥3 | Re-engage now |
| At Risk | R≤2, F≥3, M≥3 | Win back urgently |
| Hibernating | R=1, F=1-2, M=1-2 | Test reactivation |
| Lost | R=1, F=1, M=1 | Suppress or last-chance |
Here, we have no core groups. Most businesses work with 6-10 core groups because this gives you enough granularity without overwhelming your team and stretching resources with too many campaigns.
Note: This is just one model type you might choose to use. Also, the number of segments you choose to have might not be this extensive. If you’re a smaller business, it might make sense to have fewer core segments to focus on. The main thing you need to focus on here is to align your definitions and intent with your business model and resource capacities.
Step 7: Craft Specific Messaging for Each Segment
The final step is to craft targeted messaging for each segment. Here, you need to focus on developing a specific and relevant messaging strategy for each segment with an enticing offer and contact frequency that aligns with the segment type.
This is where RFM analysis helps you stop treating all customers the same.
Some example strategic messaging you might choose to go with by segment can include:
- Champions: Give them VIP status and early access to new collections, exclusive offers and discounts, and invite them to the referral program.
- New customers: Establish well-thought-out welcome sequences with incentives for second purchase, and customer testimonials and reviews
- At-risk customers: Go with the “We miss you” email strategy, do personalized win-back discounts (10-20% off), and include product recommendations based on their purchase history.
- Hibernating: Try occasional broad campaigns, “last chance” offers, and feedback surveys to understand why they’ve lost interest.
Monitoring & Updating Your RFM Model Over Time
RFM segmentation isn’t something you do once and forget about. It’s something you need to update regularly so you can understand and monitor trends in your customer behavior and segmentation groups.
So you RFM scores and segments should be recalculated on a scheduled basis. It’s up to you how often that will be. It might be monthly if you’re a large commerce business or quarterly for smaller and slower business models.
Here are some of the KPIs you should monitor by segment:
| Metric | Champions | At Risk | New |
| Revenue contribution | Track share of total | Track decline | Track growth |
| Order volume | Monitor consistency | Watch for recovery | Focus on 2nd purchase |
| Repeat purchase rate | Should be >80% | Target for win-back | Key activation metric |
| Churn rate | Should be minimal | Priority metric | 30/60/90 day rates |
| Unsubscribe rate | Monitor for fatigue | Expect higher | Keep low |
You can also do cohort analysis where you run periodic tests to see how campaigns move customers from one segment to another. You might have had a win-back campaign move 15% of At-Risk customers back to Loyal customers. This tells you the campaign worked well and you can use this information and data to build a case for more frequent, similar campaigns or to understand what resonates with customers in terms of messaging.
Ongoing maintenance checklist
These are some of the things you should have on your RFM segmentation monitoring checklist:
- Refresh RFM data (monthly/quarterly)
- Review RFM category definitions and metrics to see if they are still valid (annually)
- Check and update customer ID accuracy and remove duplicates (monthly/quarterly)
- Cancel marketing segmentation campaigns that are not delivering results
Conclusion: Closing Thoughts on RFM Segmentation
RFM segmentation is a handy method to stop second-guessing and start making real decisions based on how people actually behave as customers. When you get a clear picture (in numbers) of who’s buying frequently and who spends the most, and who’s gradually drifting away, you can take a more targeted approach with your marketing budget, messaging, and offers.
And then you can put your money where it really makes a difference.
But even the best RFM models are only as useful as the data you’ve got feeding them. If your records of purchases, conversions, or customer behaviour are all scattered across different platforms, your segments are going to lose their accuracy and usefulness. That’s why having rock-solid attribution and unified performance data in place is absolutely crucial at this stage.
Tools like RedTrack help close the gap by giving you a clean, clear view of what’s going on with customer actions, across all of your channels, devices, and touchpoints.
By tracking conversions as they happen behind the scenes and tying ad performance to actual purchase behaviour, RedTrack gives you data that actually reflects what’s going on in reality, so you don’t have to make educated guesses and assumptions. That means you’ll have sharper segments and better to invest your marketing spend.Sign up for RedTrack’s 14-day free trial or book a demo to check out how the tool can ease the pain of muddled customer behavior data.