Traditional attribution models struggle to capture the reality of how people actually buy today.
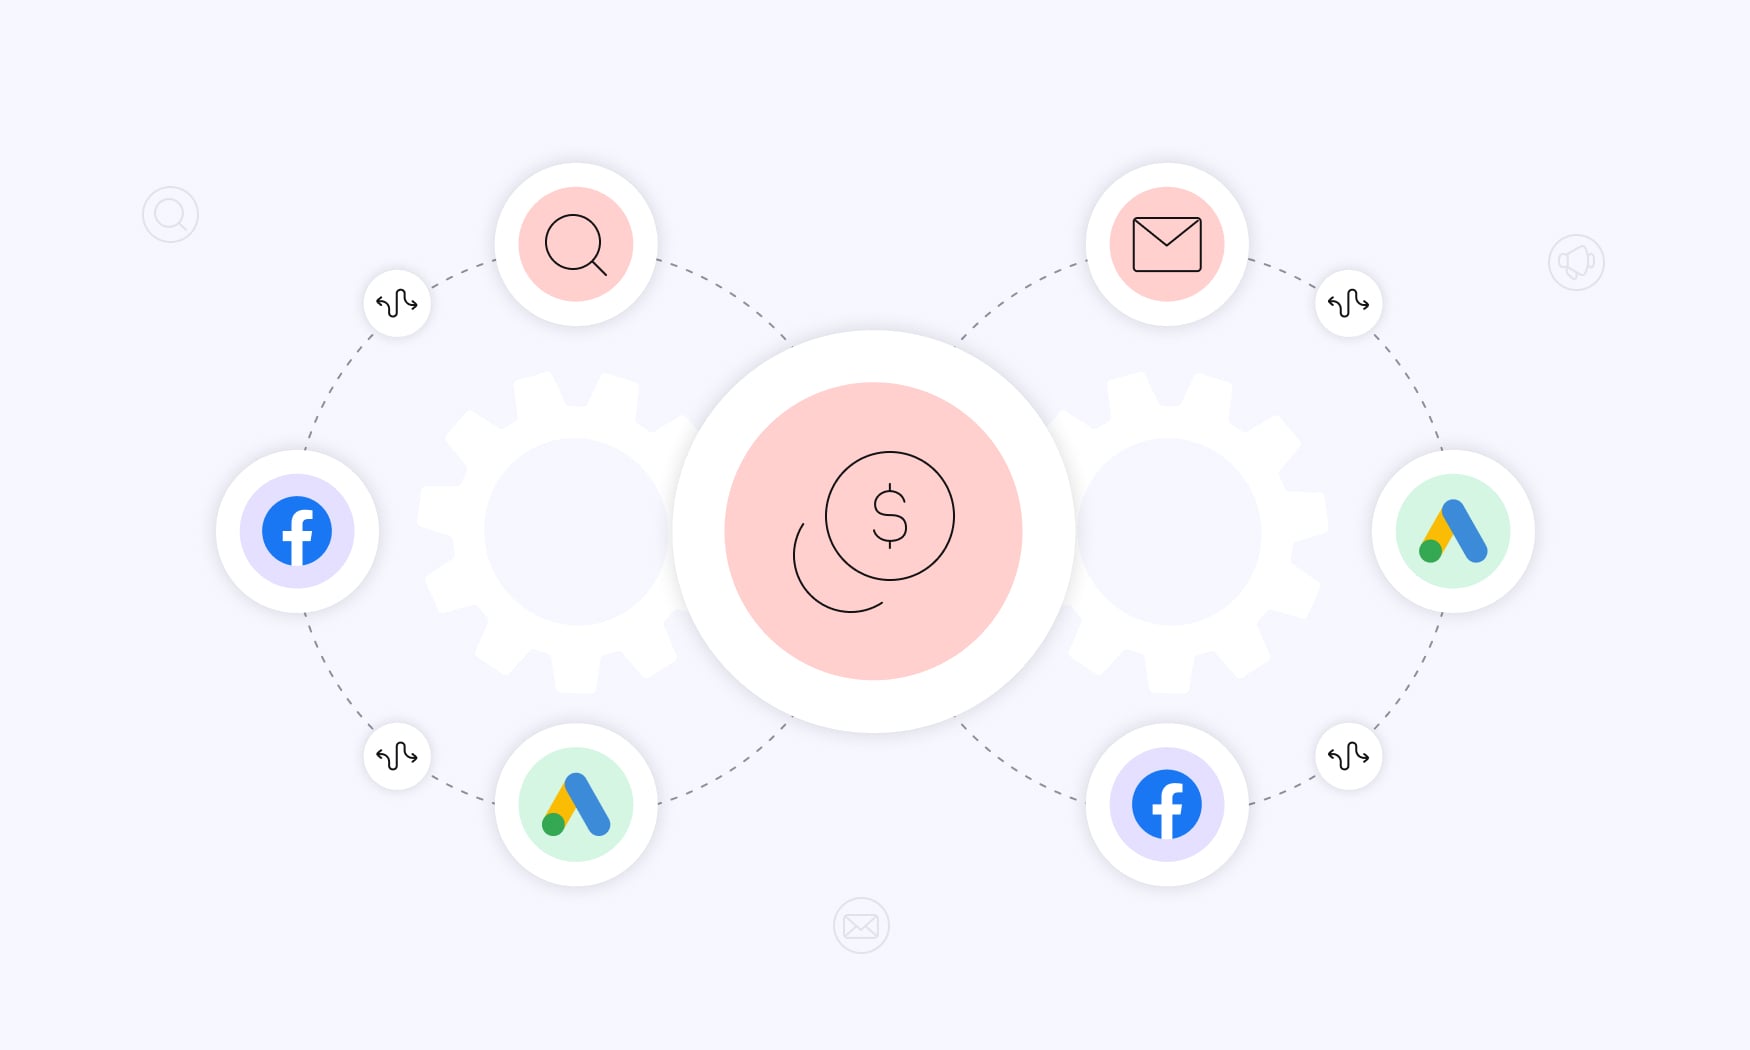
In a multi-channel world, customers rarely convert after a single click. Instead, they move through complex paths – clicking ads, opening emails, searching on Google, and revisiting social media before finally taking action. First-touch or last-touch models reduce all of that complexity to a single point, leaving marketers with an incomplete picture.
Markov chain attribution offers a smarter alternative. Instead of relying on arbitrary rules, it applies mathematical probability to real customer journeys, showing how each channel contributes to conversions. By analyzing transitions between touchpoints, it reveals the true influence of channels that traditional models often undervalue.
This guide will break down everything you need to know about Markov chain attribution – from the core concepts to practical steps for implementation – so you can make more informed budget allocation decisions and get a clearer view of your marketing performance.
What is Markov Chain Attribution Model?
A Markov chain is a mathematical model where the next step depends only on the current one, not the entire history. In marketing, that “memoryless” property makes it powerful for mapping out customer journeys.
Instead of looking at every touchpoint in isolation, the Markov Chain Attribution Model connects the dots. Each touchpoint – Google Ads, Meta, email, or organic search – is treated as a state. The model calculates the probability of a customer moving from one channel to the next until they convert.
Here’s the key difference: traditional attribution models follow rigid rules. First-click gives all credit to the first ad, last-click to the final touchpoint. Markov attribution doesn’t guess. It uses actual customer behavior to determine which touchpoints truly impact conversions.
That shift creates a more accurate view of how channels work together. For example, a keyword that rarely gets the last click might still be critical in starting the customer journey. Markov attribution reveals that hidden value.
Because it’s dynamic, the model adapts as customer behavior changes. If audiences shift toward new platforms or touchpoints, attribution values update accordingly. The result? A data-driven attribution model that reflects reality instead of assumptions.
How Markov Chain Attribution Works
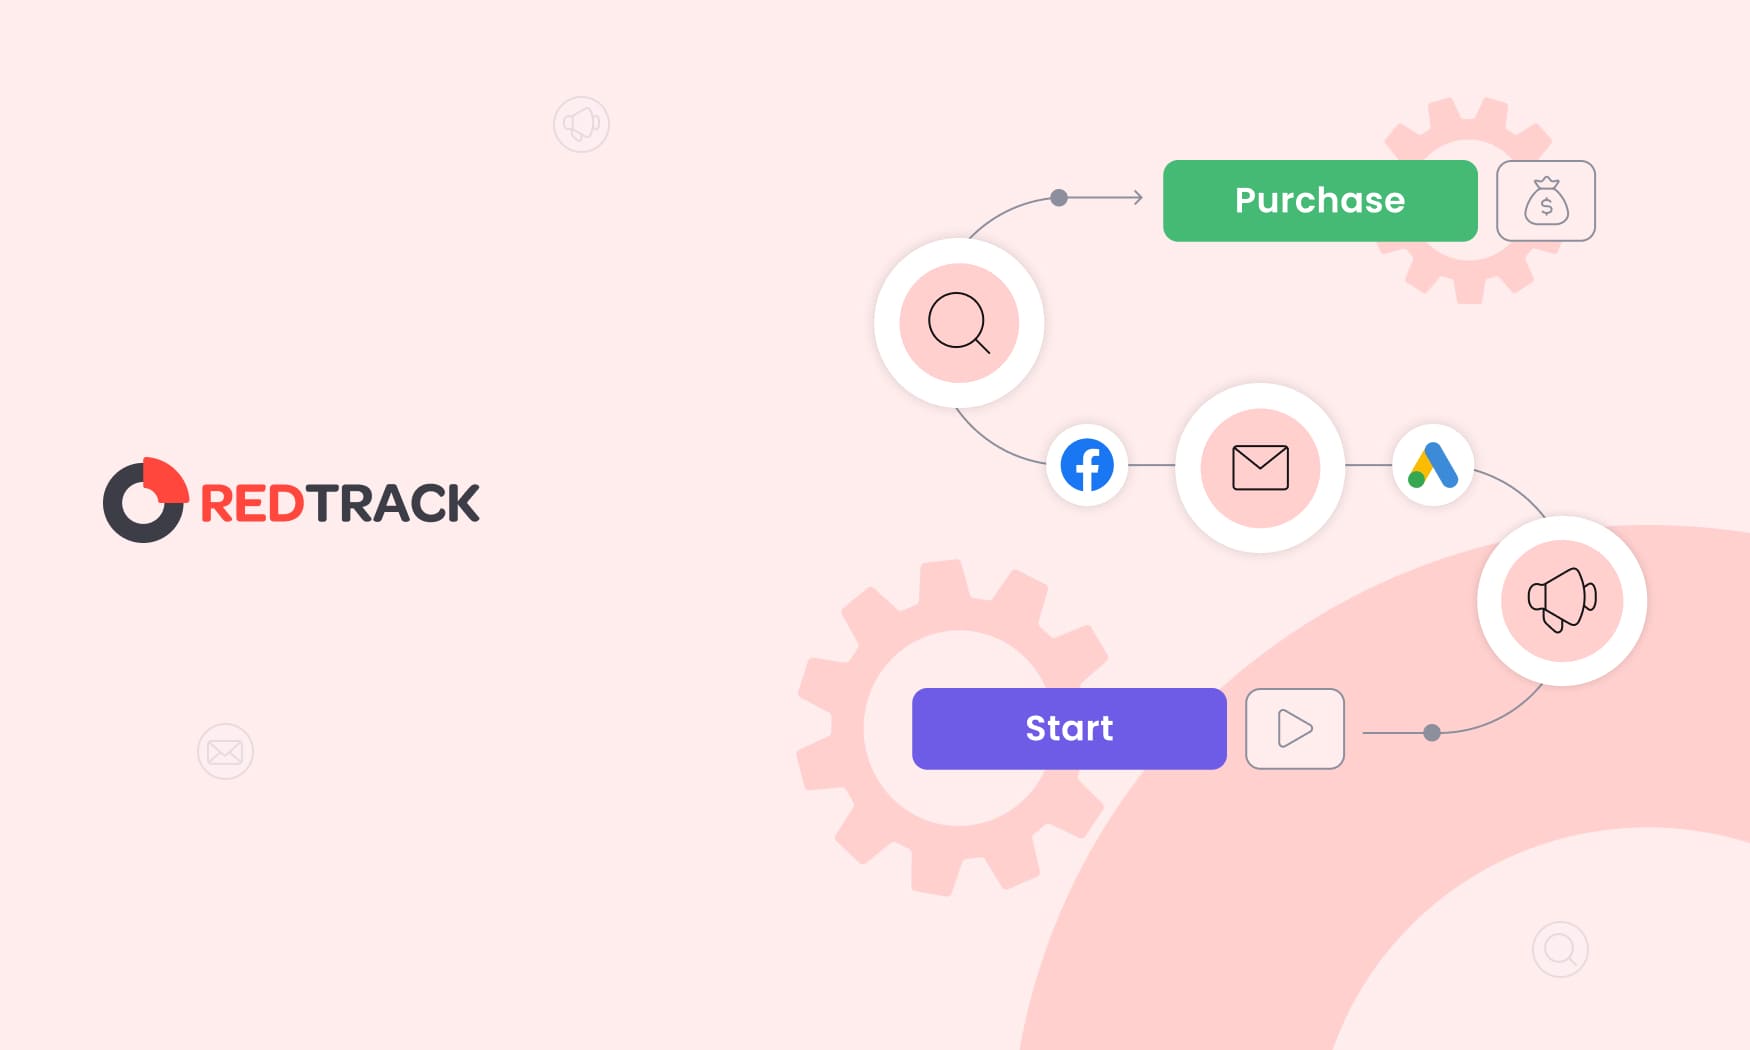
At its core, the Markov Chain Attribution Model is about mapping the customer journey as a series of “states.” Every journey starts at a START point and can end either in a CONVERSION (a sale, signup, or another goal) or a NULL state (no conversion).
Think of it as customers moving step by step through your marketing channels – Google Ads, Facebook, Email, Organic Search – with probabilities attached to each transition.
Here’s the thing: instead of guessing which channel deserves credit, the model looks at actual paths taken by thousands of customers and calculates the likelihood of moving from one touchpoint to another.
For example, if 1,000 customers first clicked on Google Ads and 400 of them continued via Organic Search, the probability of moving from Google Ads → Organic Search is 40%. That’s the data-driven foundation of this model.
Let’s walk through a simplified example with four channels:
- Path 1: Google Ads → Facebook → Conversion (500 times)
- Path 2: Organic Search → Email → Conversion (300 times)
- Path 3: Google Ads → Email → Facebook → Conversion (200 times)
- Path 4: Facebook → Google Ads → Conversion (150 times)
Each path’s probability is calculated by multiplying the probabilities of its individual transitions. Over thousands of customer journeys, this math highlights how each touchpoint contributes – even if it’s not the first or last click.
The bottom line? Markov attribution provides a realistic, data-backed picture of how your marketing channels work together, showing which ones are essential to driving conversions and which ones are simply along for the ride.
Transition Probability Calculation
The math behind transition probabilities is simpler than it sounds. To calculate the probability of moving from one channel to another, you just divide:
Number of transitions from Channel A → Channel B ÷ Total transitions from Channel A
For example, if Instagram Ads led to 1,000 next interactions, and 400 of those were through Google Search, then the transition probability is:
Instagram Ads → Google Search = 400 ÷ 1,000 = 40%
Each channel can branch into multiple outcomes, but the probabilities always need to add up to 100%. Suppose Google Ads transitions break down like this:
- Google Ads → Facebook: 30%
- Google Ads → Email: 25%
- Google Ads → Organic Search: 35%
- Google Ads → Conversion: 10%
Together, those transitions equal 100%, which keeps the model valid.
Here’s the thing: accuracy depends heavily on having enough data. As a rule of thumb, you want at least 10 times more transitions than the number of touchpoints you’re analyzing. Smaller datasets can lead to misleading results, so it often makes sense to group similar channels or expand the data collection window.
While tools like the channelattribution library in Python or R can automate these calculations, understanding the logic behind them is what helps marketers spot anomalies and trust the output.
The best part? Once probabilities are calculated across all paths, you finally get to see how each channel actually contributes to conversions – not just what the last-click model tells you.
The Removal Effect: Core of Markov Attribution
At the core of the Markov Attribution Model is the removal effect – a way to measure how much each channel truly drives conversions. The idea is simple: test what happens when you remove a channel from the customer journey.
The model runs two scenarios:
- Calculate the conversion probability with all channels included.
- Remove one channel from every path and recalculate the probability.
The difference between the two results shows that channel’s removal effect.
For example:
- With all channels, conversion probability is 12%.
- Remove Google Search → probability drops to 8% (a 4-point removal effect).
- Remove Email → probability drops to 10.5% (a 1.5-point effect).
This tells us Google Search plays a bigger role in driving conversions than Email – even if both show up in reports. That insight is critical for deciding how to allocate credit and budget across channels.
The formula is straightforward:
(Conversion Probability with All Channels – Conversion Probability without Channel X) ÷ Conversion Probability with All Channels × 100
To keep results meaningful, the normalization step adjusts all removal effects so they sum to 100%. That way, each channel’s contribution is clear and directly comparable.
Calculating Channel Attribution Values
Here’s how the removal effect calculation works in practice:
- Calculate the baseline – find the conversion probability with all channels active.
- Remove one channel – recalculate the probability without Channel A.
- Measure the effect – subtract the new probability from the baseline to get Channel A’s removal effect.
- Repeat the process – do the same for every other channel.
- Normalize the results – convert removal effects into percentages so they add up to 100%.
The normalization formula is:
Channel Attribution = (Channel Removal Effect ÷ Sum of All Removal Effects) × 100
Here’s a real-world example with conversion values and budget allocation. Suppose your analysis shows these removal effects:
| Channel | Removal Effect | Attribution % | Monthly Conversions | Value per Conversion |
| Google Ads | 4.2% | 35% | 175 | $150 |
| 3.1% | 26% | 130 | $145 | |
| 2.8% | 23% | 115 | $160 | |
| Organic Search | 1.9% | 16% | 80 | $155 |
What does this tell us? Google Ads and Facebook contribute far more to conversions than last-click models would suggest. Budget should shift toward them to maximize returns.
And if your removal effects don’t neatly add up to 100%? That’s usually a data quality issue – incomplete conversion paths or missing tracking points can skew the math. Cleaning up your tracking ensures the attribution model reflects reality.
Advantages of Markov Chain Attribution
The biggest advantage of Markov Chain Attribution is that it’s driven by real customer behavior, not arbitrary rules. Traditional models like position-based or linear attribution split credit evenly, no matter the context. Markov models, on the other hand, adapt credit assignment based on actual interaction patterns.
Why sequence matters
Markov attribution recognizes that the order of touchpoints matters. A customer who sees a Facebook ad, then searches your brand on Google, then clicks an email is on a very different journey than someone who opened the email first. Those paths don’t carry the same likelihood of conversion – and the model reflects that.
More accurate than first- or last-click
Unlike first- or last-click attribution, which credit a single touchpoint, Markov models consider the entire conversion path. This is how hidden mid-journey touchpoints – the ones often ignored – finally get the credit they deserve.
Perfect for multi-channel campaigns
For businesses running complex, multi-channel marketing, Markov attribution shines. It doesn’t need billions of data points like some machine-learning approaches. Even with moderately sized datasets, it can deliver reliable insights into how each channel contributes to conversions.
Lighter but still powerful
Compared to other algorithmic models such as Shapley value attribution, Markov models are less computationally heavy but still provide sophisticated credit assignment grounded in mathematics, not guesswork.
Accessible for growing businesses
Because it handles smaller datasets better than many algorithmic approaches, Markov attribution isn’t just for enterprise players. Mid-sized businesses can use it, too, gaining deeper visibility into multi-channel campaigns without needing enormous data volumes.
The bottom line? Markov Chain Attribution balances accuracy, efficiency, and accessibility, making it one of the most practical attribution models for performance-driven marketers.
Challenges and Limitations
Like any attribution model, Markov chains come with challenges that marketers need to be aware of. The most important? Data quality.
1. Data quality requirements
For reliable results, the model needs complete conversion path data. That means robust tracking across all channels and touchpoints – if data is missing, transition probabilities (and the attribution model itself) become less accurate.
2. Incomplete customer journey data
Some platforms, like Google Analytics, only report conversion paths and ignore non-converting journeys. This creates blind spots. Without the “failed paths,” probability calculations are skewed and may over-credit certain channels.
3. Single-channel conversions
If a customer converts after touching only one channel, there are no transitions to analyze. These paths don’t provide useful input for calculating removal effects, which can make attribution less meaningful in single-touch scenarios.
4. Loops and repeated interactions
Customers often revisit the same channel multiple times (e.g., multiple Facebook ad clicks). The model has to decide how to treat those loops while still keeping the math consistent – which adds complexity.
5. Normalization errors
If removal effects don’t neatly sum up to 100%, it’s a red flag. This usually points to tracking gaps or data quality issues that need to be addressed before trusting the output.
6. Higher-order Markov chains
First-order models only consider the current state, which keeps things simple. Higher-order chains include previous states too, which can increase accuracy but demand more data and computing power – a trade-off for marketers to weigh.
Handling Complex Scenarios
Customer journeys are rarely neat. They often include loops, repeated touches, and single-channel conversions that complicate attribution modeling. Managing loops means deciding how to handle repeated channel interactions.
Some implementations count every revisit as a separate state, while others group them within defined time windows. The right approach depends on your business model. In long B2B sales cycles, multiple visits to the same channel might reflect distinct buying stages and should be modeled separately. In faster eCommerce journeys, it may make more sense to treat repeated touches as a single interaction.
Single-touchpoint conversions create another challenge since they don’t provide transitions between channels. You can either exclude these from the Markov chain analysis while tracking them separately, or use a hybrid model that applies Markov attribution to multi-touch journeys and simple attribution to single-touch conversions.
Finally, the lack of data on non-converting paths can skew results. Because many analytics platforms only record conversion journeys, attribution models often rely on approximation techniques to estimate what the full customer journey universe looks like. These statistical methods help fill the gap, but they also introduce additional uncertainty into the calculations.
Implementation Requirements and Tools
To run a Markov chain attribution model effectively, you need a solid data foundation. That starts with tracking every customer touchpoint across all your marketing channels using consistent user identification. Cross-device tracking, standardized UTM parameters, and comprehensive event tracking are essential to capture the full picture of interactions with your brand.
Google Analytics Multi-Channel Funnel reports can provide a starting point for conversion path data, but they usually fall short on non-converting paths, which are critical for accurate probability calculations. To fill the gaps, you’ll need to combine data from multiple systems – ad platforms, CRM, email tools, and more – into a single source of truth.
For implementation, marketers often turn to programming tools:
- In Python, the channelattribution library comes with pre-built functions for Markov chain attribution, while pandas and numpy handle the heavy lifting of data manipulation and calculations.
- In R, specialized packages exist to process conversion path data and calculate attribution values with relatively little coding effort.
A data warehouse integration makes this process much easier, allowing you to bring together Google Analytics, CRM systems, email platforms, and ad network data into one unified dataset for analysis.
As for scale, there’s a basic rule of thumb: you need at least 10 times more transitions than channels to generate reliable results. For example, if you’re analyzing 8 marketing channels, you’ll want at least 80 distinct channel transition observations to make the model statistically sound.
Python Implementation Guide
Implementing Markov chain attribution in Python starts with installing the right tools. The key packages are:
pip install channelattribution pandas numpy matplotlib
and then
- channelattribution provides pre-built functions for Markov modeling.
- pandas and numpy handle data organization and calculations.
- matplotlib is used for visualization.
Once installed, the next step is data preprocessing. Conversion path data needs to be formatted into a structure the library can understand. Typically, this means creating a DataFrame with:
- Customer ID (optional, depending on dataset)
- Touchpoint sequence
- Conversion indicator
- Conversion value
Here’s a simple example of running a first-order Markov model:
import channelattribution as ca
import pandas as pd
# Prepare your data
paths = pd.DataFrame({
‘path’: [‘Google Ads > Facebook > Conversion’,
‘Email > Google Ads > Conversion’,
‘Organic Search > Email > Conversion’],
‘conversions’: [100, 150, 75]
})
# Calculate attribution
attribution = ca.markov_model(paths, ‘path’, ‘conversions’)
print(attribution)
Beyond raw outputs, visualization is key. Using libraries like markovchain, you can map transition probabilities and customer flows. These visual diagrams make attribution insights far easier to communicate with stakeholders who don’t live in spreadsheets.
Finally, it’s useful to compare heuristic models (first-click, last-click) against your Markov results. This validates your setup and highlights the difference between rule-based attribution and truly data-driven credit assignment.
Markov Chain vs Other Attribution Models
When comparing attribution models, it’s important to understand what each one does well – and where it falls short.
Take Shapley value attribution. It’s built to be perfectly fair, because it looks at all possible channel combinations when assigning credit. The downside? It’s extremely data- and computation-heavy. Markov chain attribution, in contrast, focuses on sequential patterns in customer journeys. It captures the real order of interactions without requiring the same level of complexity, making it far more practical to implement.
Now compare Markov chains with more common rule-based models. Linear attribution splits credit equally across all touchpoints, whether or not they truly influenced the outcome. Time decay gives more credit to recent interactions, but it does so arbitrarily. Markov attribution avoids these shortcuts because it assigns credit based on observed customer behavior – the actual paths people take before converting.
The accuracy difference becomes clear in complex journeys. For example, a path like “Display Ad → Email → Google Search → Email → Conversion” would look very different under last-click, linear, or time decay models. Markov attribution recognizes the real contribution of each channel in that sequence, not just the first or last click.
There’s also the question of efficiency. Compared to machine learning–based attribution, Markov models are lighter to run but still give data-driven insights. That makes them especially useful for teams that want to move beyond first-click and last-click without needing a full data science stack.
So, when should you choose Markov over other approaches? If you have enough path data to work with but don’t need the “perfect fairness” of Shapley or the heavy lift of advanced ML models, Markov chains strike the right balance: accurate, practical, and scalable.
Conclusion – Do You Really Need Markov Chain Attribution Model?
Markov chain model is a powerful way to understand how different channels shape the customer journey. By looking at sequential patterns instead of rigid rules, it uncovers the true impact of touchpoints that often get overlooked in first-click or last-click models. For data teams with the time, resources, and technical expertise, it can provide deep insights into how channels work together.
But here’s the thing: most performance marketers don’t need to build a Markov model from scratch to get value from multi-touch attribution. What they need is accurate, real-time conversion data across all channels, combined with flexible attribution models that reflect how their customers actually behave.
That’s exactly where RedTrack comes in.
With server-side tracking, automated cost updates, and conversion path reports, RedTrack gives media buyers, agencies, and eCom brands the clarity they need to optimize spend and scale winning campaigns – without coding probability models or stitching together incomplete datasets.
The bottom line? Markov chain attribution is an excellent academic and data-science approach. RedTrack delivers the same core benefit – clear, unbiased visibility into the customer journey – in a solution that’s built for speed, accuracy, and growth.