As an e-commerce store owner, you want to see a surge in website traffic. But here’s the thing: when it comes to ecommerce growth, vanity metrics (think click-through rates and ranking high on organic search) just won’t cut it.
If you want to scale your online business and make more money in 2025, you need to track the figures that actually beef up your bottom line. That’s why in this post, we’ll take a look at the best ecommerce growth metrics to track and why they’re so important.
What Are Ecommerce Growth Metrics?
Ecommerce growth metrics are key indicators that measure how well your online store is growing. The best thing about these metrics is that they offer complete visibility into your ecommerce performance. You can see how well your business attracts customers, converts web traffic into sales, and retains those customers.
Unlike general KPIs that measure your overall performance across various aspects of running an online retail store, growth metrics focus on areas of your business that drive sustainable business growth.
Why Track Ecommerce Growth Metrics?
Ecommerce growth metrics show you whether or not your online store is successful. But it’s not just about numbers. It’s more about understanding what these figures mean for your business.
Tracking growth metrics for ecommerce sites can help you:
- Identify profitable marketing channels — discover channels that generate the most sales (especially if you’re running a cross-channel marketing strategy).
- Spot high-performing traffic sources — see if Google search, social media platforms, or paid ads drive the most traffic to your website.
- See potential drop-offs — see exactly where many visitors exit your site, then address the weak parts of your sales funnel.
- Know what your customers like — personalize your offers and marketing communication so they appeal to different customer groups based on what they prefer.
- Make informed decisions — use actionable insights from these metrics to make data-driven decisions that boost revenue growth.
- Outsmart Competitors — identify buyer behavior changes, quickly adjust to new patterns, and leave your competitors far behind.
Top 18 Ecommerce Growth Metrics
If you’re serious about making more money selling online, explore this ecommerce metrics list and start tracking the figures that truly matter.
1. Customer Acquisition Cost
Customer acquisition cost means how much money you spend to gain a new customer. This includes the money you spend on:
- sales team salaries;
- marketing expenses;
- cost of ecommerce software;
- paid ads.
CAC tells you whether or not your marketing strategies are paying off. If the figures are too high, this means your campaigns aren’t performing well. To lower your CAC, consider generating organic traffic through content marketing and search engine optimization. You may also need to refine your audience targeting tactics so the right people can find you. Then, encourage word-of-mouth marketing through referral programs and other incentives.
Use this formula to calculate your customer acquisition cost:
CAC = sales and marketing expenses / number of new customers
2. Customer Retention Rate (CRR)
When you’re growing an online business, you need to consider how many customers are sticking around. Studies have shown that acquiring a new buyer costs up to 25 times more than selling to someone who has bought from you in the past. So, if you want to stay profitable, customer retention must be a huge part of your marketing strategy.
Here’s how to calculate this metric:
CRR = ((E – N) / S) x 100
Where:
- E stands for the number of new customers at the end of a specific period;
- N means the number of new customers you gain during that period;
- S is the number of customers you already have at the start.
3. Add-to-Cart Rate
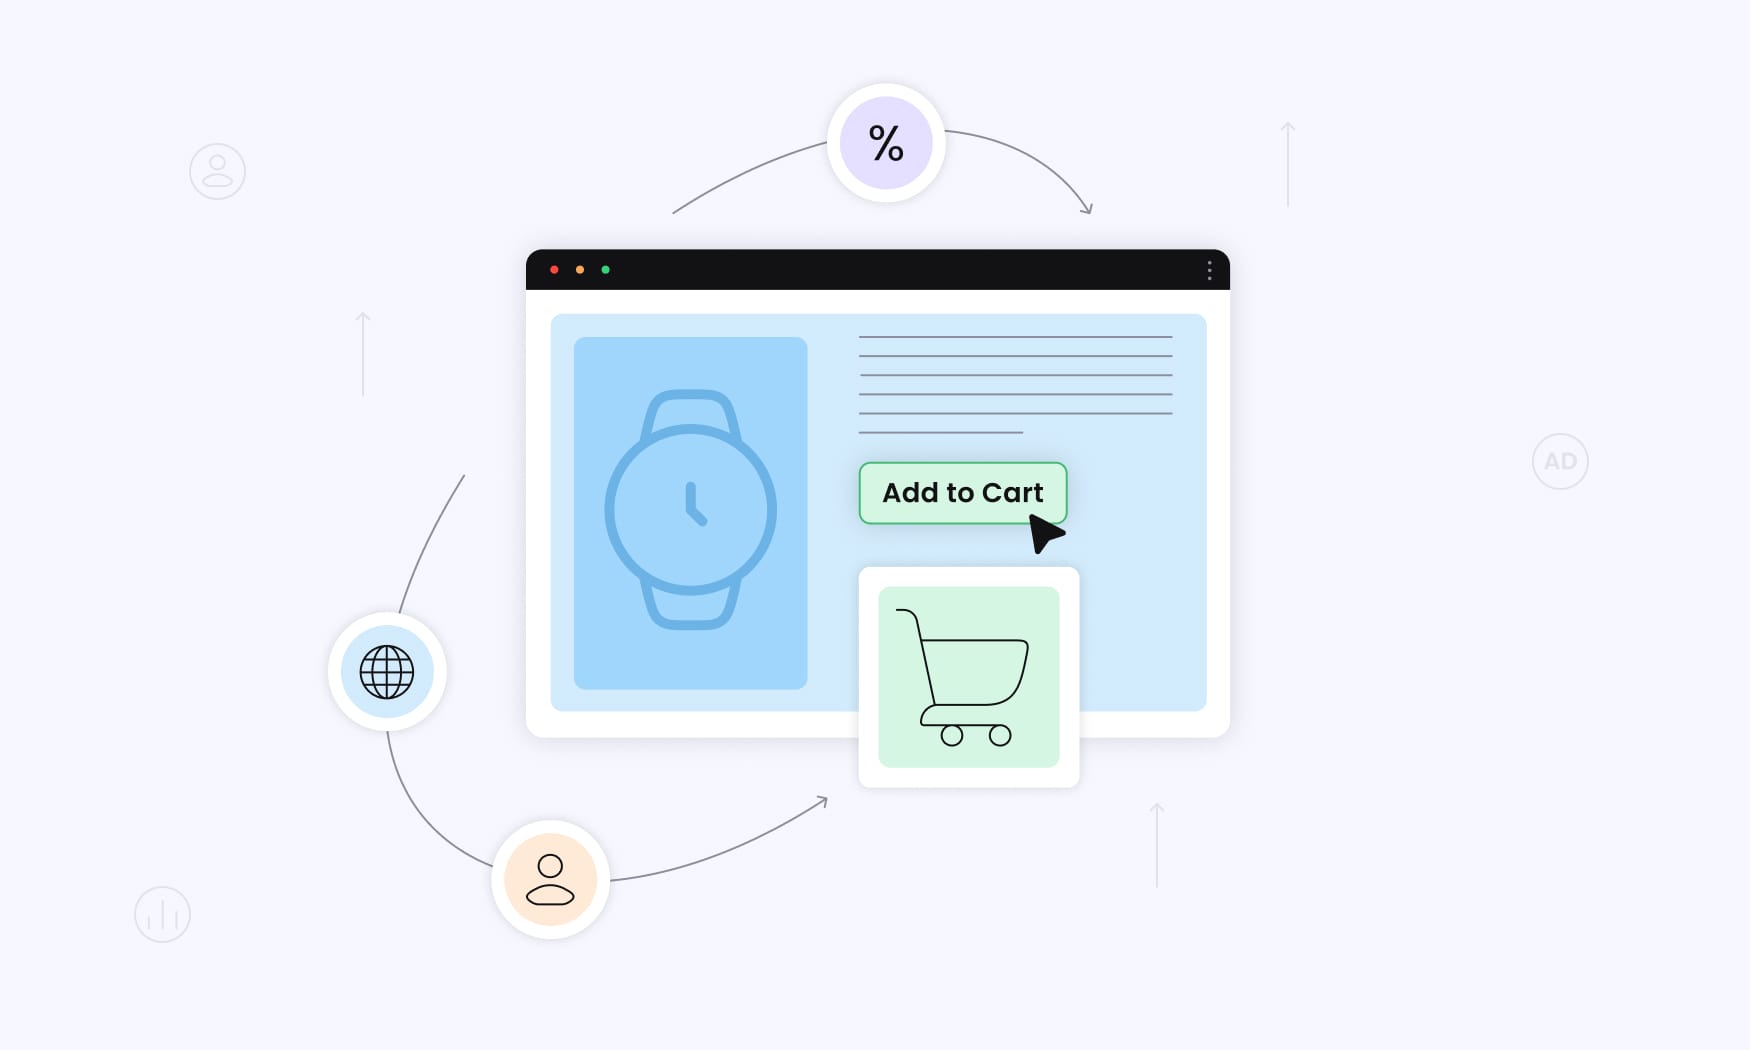
Your add-to-cart rate is the percentage of people who visit your store and add a product to their cart. If you’re getting a lot of traffic but not a lot of sales, it’s because most people aren’t adding anything to their carts.
Here’s the add-to-cart rate formula:
Add-to-cart rate = (sessions with add-to-cart events / total sessions) x 100
If the figures you get are low, you can improve them through:
- benefit-driven product descriptions and high-quality images;
- bold add-to-cart buttons that are easy to find;
- countdowns and limited-time offers to create urgency;
- discounts or play-to-win games that buyers can’t resist.
4. Shopping Cart Abandonment Rate
This metric tells you the percentage of people who added items to their shopping carts but didn’t complete the checkout process. Typically, you want everyone who views your product to make a purchase. But in reality, only a fraction of them will. So, it’s no wonder cart abandonment rate reached an all-time high of 70% in 2023.
Curious about your cart abandonment rate? Follow this formula:
CAR = (completed transactions / transactions initiated) x 100
If you get less than 75%, that’s a sign your e-commerce store is growing well. Higher figures would mean you’re losing sales at the final stage of the customer journey, usually because:
- Your checkout process is too complex — use one-page checkout forms that are easy to fill out.
- Buyers don’t see their preferred payment methods — offer multiple payment methods, including debit cards, credit cards, and online payment processors like PayPal.
- Your shipping fee is too high — consider offering free or discounted shipping when buyers spend up to a particular amount.
- You don’t have enough trust signals — display customer reviews and user-generated content on your online store.
5. Revenue Per Visitor (RPV)
Also called earnings per visitor, RPV measures the amount of money you generate whenever someone visits your online store.
The formula is pretty straightforward:
RPV = total revenue / total number of visitors
To boost your RPV, focus on increasing the number of customers who buy your products. Also, improve the quality of your marketing campaigns and targeting efforts. Give it time, and you’ll definitely see an uptick in the revenue each visitor fetches you.
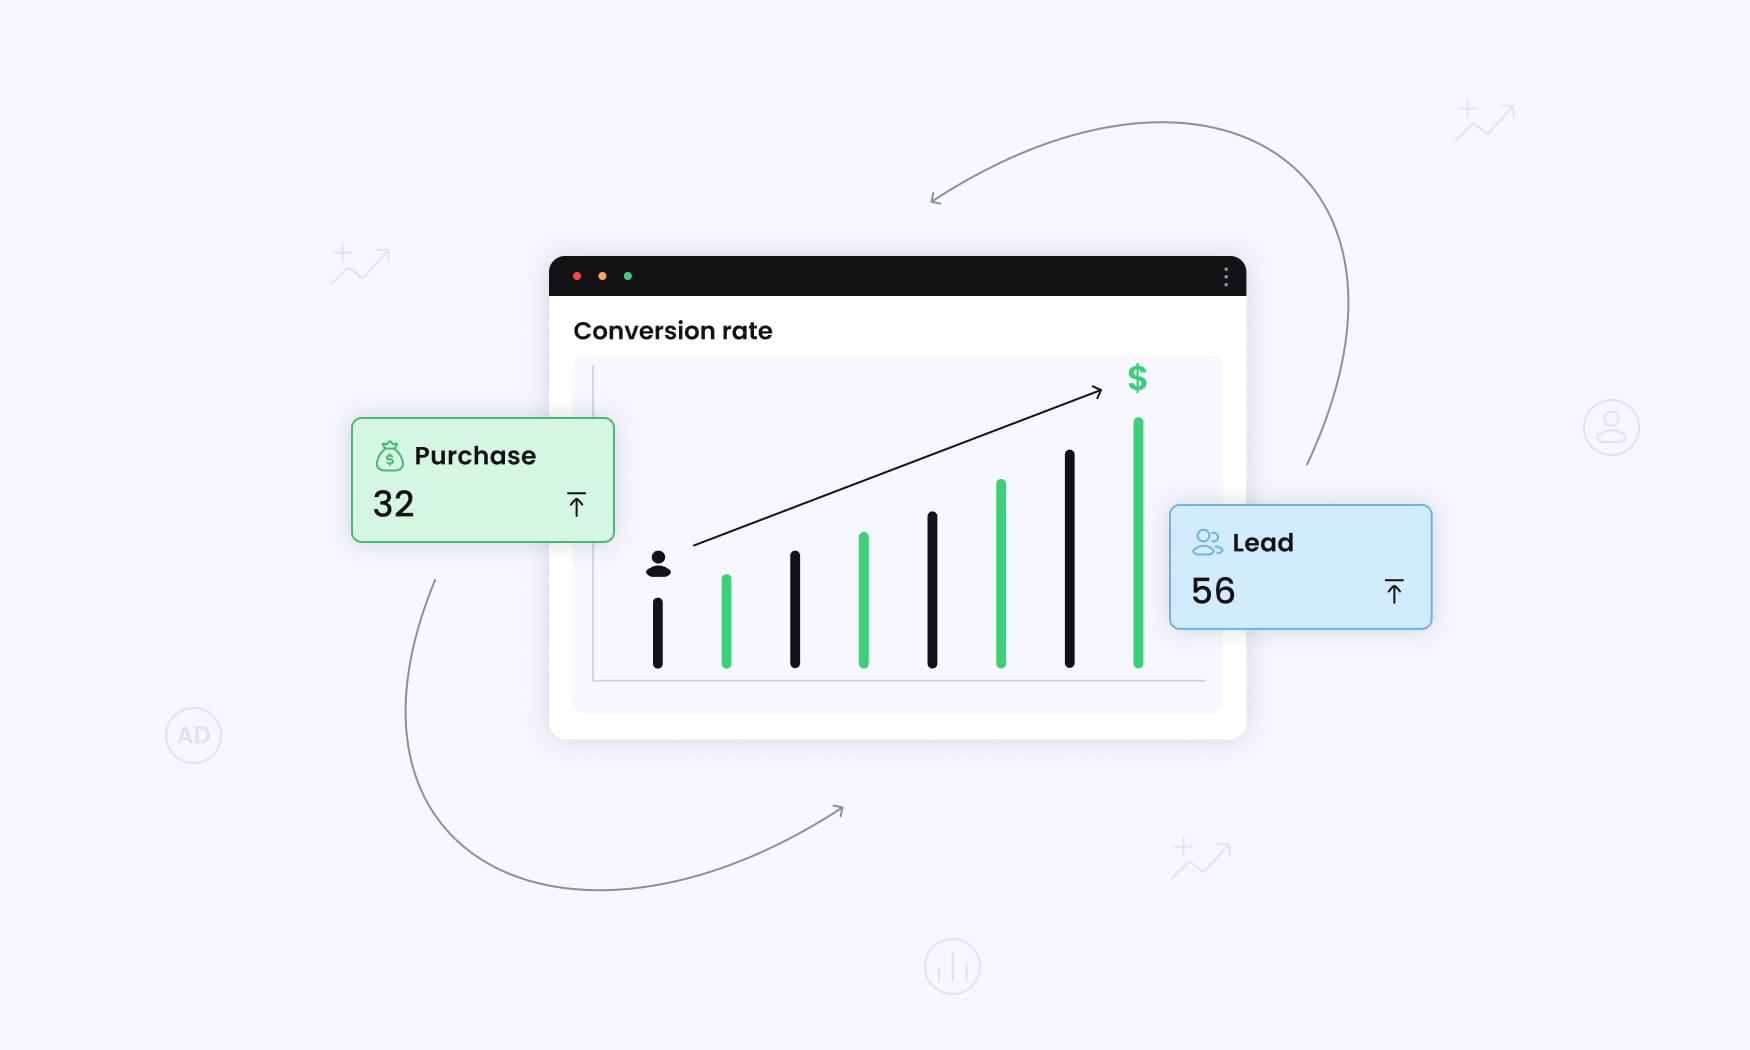
6. Conversion Rate
Waking up to new orders is every online store owner’s dream. If you don’t make a sale, your store will be among the 90% of e-commerce businesses that fail within the first four months of operation.
However, when it comes to e-commerce performance, a sale is only one of many conversion events. You record a conversion each time a prospect or customer takes a desired action, including:
- creating an account;
- adding products to carts;
- signing up for a free demo;
- contacting customer support;
- wishlisting items;
- subscribing to your newsletter;
- completing a survey;
- submitting a contact form;
- following you on social media.
For ecommerce conversion tracking, choose the customer action that contributes the most to your business goals. Then, divide the number of conversions by the total number of visitors.
Conversion rate = number of conversions / total number of visitors
Higher conversion rates means more revenue without needing more traffic.
7. Repeat Purchase Rate (RPR)
Your repeat purchase rate is another e-commerce growth metric you shouldn’t sleep on. It measures the number of existing customers who return to your store to make another purchase.
A high repeat purchase rate means you’ve got a lot of satisfied buyers. These ones are more likely to tell others about your brand. And according to the 2023 Nielsen Annual Marketing Report, 92% of customers trust user recommendations over a brand’s marketing efforts. So, there’s a high chance you’ll acquire new customers through word-of-mouth marketing, and without injecting a lot of funds into ads.
The formula for calculating your RPR is as follows:
RPR = (number of returning customers / total customers) x 100
Simple things like “thank-you” messages, reengagement emails, and real-time order tracking can boost a low RPR.
8. Customer Lifetime Value (CLV)
Customer lifetime value is one of the strongest ecommerce KPIs for performance tracking. It’s the total net profit you expect to earn from a customer throughout your business relationship.
If your CLV is high, you can afford to spend a little more on customer acquisition without making a loss. Plus, it’s easier to forecast your total revenue and plan for business growth.
To calculate your customer lifetime value, you’ll need to know your customer value first. It’s the result you get after multiplying your average purchase value by the average number of purchases.
Then, proceed with this formula:
CLV = (T x AOV x AGM x ALT) / total customers
Where:
- T is the average number of transactions for a specific period;
- AOV means average order value;
- AGM stands for average gross margin;
- ALT means average customer lifespan.
9. Cost Per Conversion
As the name implies, cost per conversion measures how much you spend to convert a website visitor into a paying customer. It’s similar to customer acquisition costs, but in this case, you’re looking at how much you spend on ads to achieve a single conversion.
This metric helps you identify areas to reduce advertising expenses without hurting your campaign performance.
Use this formula to calculate your cost per conversion:
CPC = total ad spend / number of conversions
10. Average Order Value (AOV)
Average order value means the median amount a customer spends whenever they shop at your website. A high AOV often results from a positive customer experience, which is something to aim for if you want to make more sales without increasing customer acquisition costs.
Here’s how you can calculate your average order value:
AOV = total revenue / number of orders
You can improve a low AOV by making a few simple adjustments to your online store:
- Entice buyers with product bundles.
- Offer free shipping at certain thresholds (like when someone makes purchases worth $100).
- Recommend related products that people often buy together.
By tracking this metric regularly, you’ll spot patterns in customer behavior. For instance, you might find that they prefer certain product bundles or aren’t interested in multiple items. Whatever the case, accurate customer data helps you make better decisions that directly impact business performance.
11. Purchase Frequency
You also need to measure how many times a customer places orders in a specific timeframe. Because they’re existing customers, there’s no need to pour all your resources into ads and outreach.
You only need to upgrade your retention strategy through:
- strong customer relationships;
- customer loyalty programs;
- email sequences;
- discounts.
The formula to calculate your purchase frequency is as follows:
Purchase frequency = number of orders / number of unique customers
12. Inventory Turnover Rate
Your inventory turnover rate measures how many times your inventory is sold and replaced during a given period, which is often a year.
To calculate your inventory turnover rate, first get your average inventory value. Add your beginning inventory value to the ending value and divide by two to get the average. Then, divide the cost of goods sold (COGS) by the average inventory value.
Inventory turnover = COGS / average inventory value
A high inventory turnover rate means your products are selling out quickly, whereas a low rate could mean either of these things:
- Your prices are too high.
- You’re targeting the wrong audience.
- Your product doesn’t meet a real market need.
- There’s more product supply than demand.
Investigate what’s behind your low inventory turnover rate, then dig into customer data to better understand their needs and pain points. This will help you adjust your pricing, product positioning, and the product itself so you can achieve sustainable growth.
13. Net Profit Margin
Your net profit margin is what’s left of your total revenue after you’ve deducted taxes and other expenses.
To get your net profit margin, use this formula:
Net profit margin = (net profit / total revenue) x 100
The goal is to stay profitable after expenses. So, if operational costs take up so much money that you barely make any profits, it’s time to reevaluate your pricing strategy.
Here are other things you can do if your net profit margin falls behind:
- Analyze operational costs and cut unnecessary expenses (like subscriptions you don’t need).
- Increase your selling price but keep your new prices fair so your target audience can still afford your products.
- Track your ROI on each campaign and cut out the least performing channels.
- Source ecommerce products from cheaper suppliers, but always prioritize quality.
- Buy goods in bulk to secure discounts (wholesale prices are usually discounted).
14. Return on Investment (ROI)
Return on investment measures the profit or loss you make on an investment, compared to the initial cost. While running your business, you could spend on things like:
- domain and hosting;
- product sourcing;
- marketing campaigns;
- relevant software (for example, email marketing, analytics, and inventory tools).
Follow this formula to calculate your return on investment:
ROI = (net profit / investment) x 100
15. Bounce Rate
Someone visits your site, spends a few seconds, then leaves without going to another page. This is known as bounce in e-commerce. Bounce rate measures the total number of visitors who leave without interacting further with your website.
These single-page sessions give you an idea of how interested your audience is in your products. If they like what they see, they’ll want to learn more and even place an order.
To get your bounce rate, follow this simple formula:
Rb = (Tv / Te) x 100
Where:
- Rb is bounce rate;
- Tv stands for total single-page visits;
- Te means total entrance visits to the site.
A high bounce rate means something isn’t working. Maybe your copy isn’t persuasive enough. Or the site loads slowly. It could also be that the landing page doesn’t match what people expect to find after interacting with your ad.
If visitors are always leaving your store in a hurry, step up your marketing game with this checklist:
- Make your site mobile-friendly.
- Don’t overwhelm visitors with blocks of text (create white space using short paragraphs and by breaking up text with stunning ecommerce product videos and images).
- Use a clear CTA.
- Ensure your site loads fast, preferably in two seconds or less.
- Use a tone and message that’s consistent with what’s in your ads.
16. Lead-to-Customer Ratio
As the name implies, the lead-to-customer ratio shows you the percentage of prospects who convert into customers. Not only does this metric update you on how well your online business is growing, but it also helps you evaluate your ecommerce marketing strategy and make the needed tweaks.
For instance, if less than 1% of your leads convert, you’re probably not targeting the right people or your offerings don’t resonate with them. To improve this ratio, find loopholes in your sales funnel and implement any of these fixes that corresponds:
- Nurture leads with email sequences.
- Use cookieless retargeting to appeal to a warm audience (people who have previously interacted with your ads).
- Write a compelling copy with a bold CTA button.
- Hook your audience with aesthetically pleasing landing pages.
- Enhance the user experience by optimizing your web pages for different screen sizes.
- Build trust by displaying customer reviews.
- Provide helpful resources to guide prospects through the sales funnel.
To calculate this ecommerce metric, plug your values into the following formula:
Lead-to-customer ratio = (number of customers / number of leads) x 100
17. Total Revenue
Your total revenue (aka gross profit) is the total amount earned from sales before deducting any expenses. This is one of the most important ecommerce growth metrics because it gives you a snapshot of your business’s overall health.
You can calculate your revenue in two ways:
- Add up all the sales income you’ve generated during a specific time frame.
- Or, multiply the total units sold by the price per unit.
18. Net Promoter Score
Net promoter score is an ecommerce metric that measures customer satisfaction based on their willingness to recommend your products. On a scale of 0-10, you ask customers certain questions to gauge their shopping or post-purchase experience.
You could ask them something along these lines: “How likely are you to recommend Product X to a friend?”
Here’s a look at how the responses are graded:
- 0-6 — detractors (unhappy customers who are less likely to recommend your products).
- 7-9 — passives (satisfied but not keen on advocating for your brand).
- 9-10 — promoters (satisfied and enthusiastic about telling others about your products).
Concluding Thoughts on Ecommerce Growth Metrics
As you’ve seen in this ecommerce metrics list, it’s not enough to rack up organic search rankings and impressions. What really matters is that you’re tracking the right metrics. By keeping a close eye on key performance indicators, you’ll gain valuable insights into your business’s health.
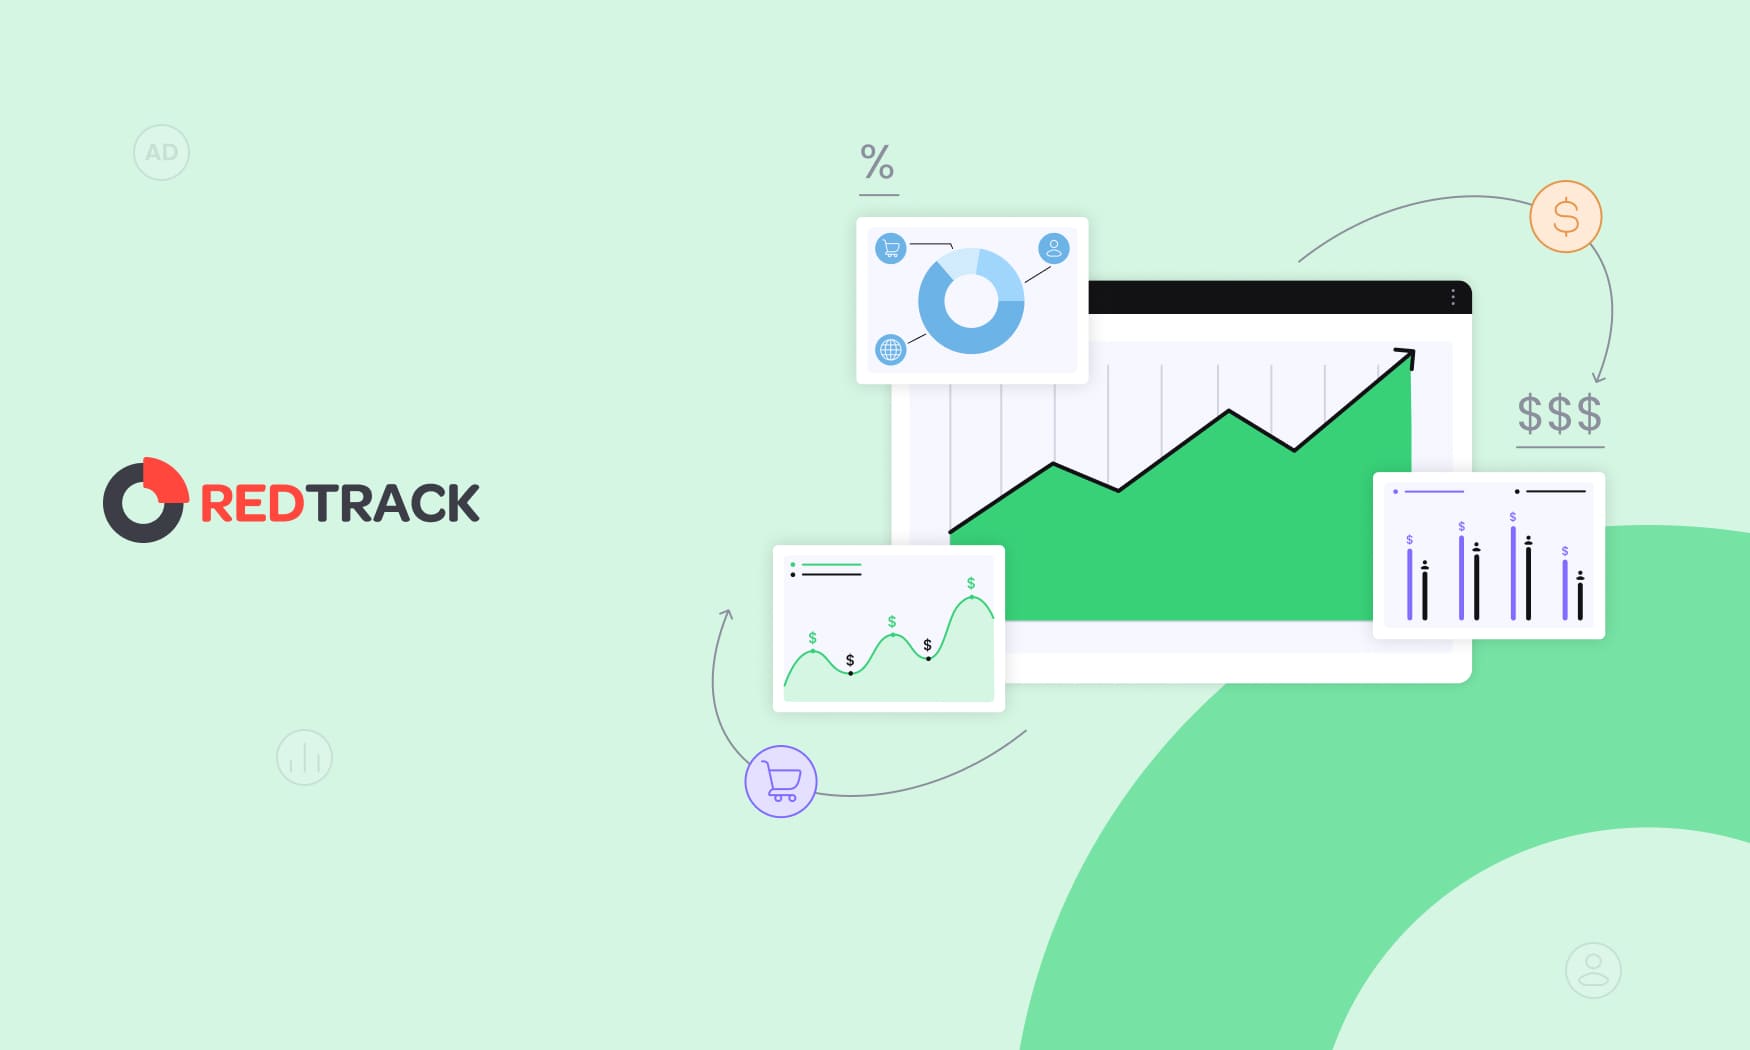
If you’re looking for a reliable platform that simplifies campaign optimization, we got you covered!
RedTrack offers powerful solutions like Conversion API, helping you track conversions across your favorite ecommerce platforms. You’ll get real-time insights into what’s driving sales, which campaigns are eating your budget, and how customers interact with your store, all from a single dashboard.
Want to see how RedTrack works? Feel free to book a demo, and we’ll show you how easy it is to boost your ecommerce ROI!